AUD/USD has recovered swiftly after the Reserve Bank of Australia decided to cut interest rates as expected. Can it challenge 0.7000 once again? Resistance is close.
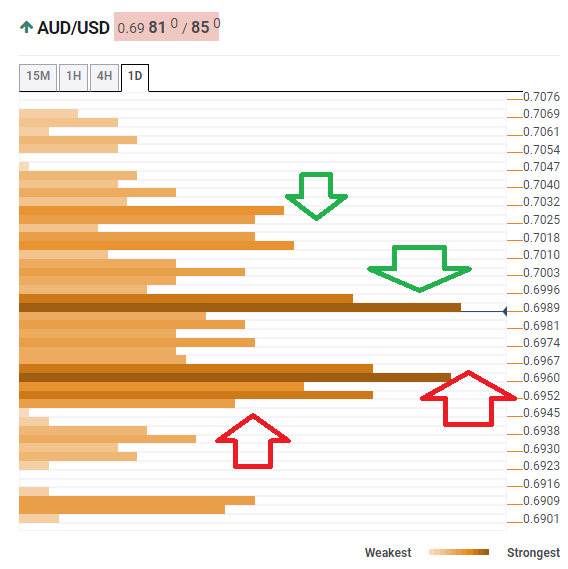
The Technical Confluences Indicator shows that AUD/USD faces a dense cluster of lines at 0.6989. It includes the Fibonacci 38.2% one-day, the previous 1h-high, the Fibonacci 38.2% one-week, and the Simple Moving Average 10-4h.
If the Aussie breaks higher, it has room to run toward the 0.7014-0.7028region, where we see many technical lines but somewhat spread out and not as robust as the previous levels. The area includes the previous yearly low, the Pivot Point one-day Resistance 1, the Bollinger Band 4h-Upper, and the SMA 100-1d.
Support awaits at 0.6960, where we note the convergence of the SAM 50-1d, the BB 4h-Lower, the BB 15min-Lower, and the PP 1w-S3.
Close by, further support awaits at 0.6948 which is the confluence of the SMA 10-1d, the Fibonacci 38.2% one-week, and the BB 1d-Middle.
Here is how it looks on the tool:
Confluence Detector
The Confluence Detector finds exciting opportunities using Technical Confluences. The TC is a tool to locate and point out those price levels where there is a congestion of indicators, moving averages, Fibonacci levels, Pivot Points, etc. Knowing where these congestion points are located is very useful for the trader, and can be used as a basis for different strategies.
This tool assigns a certain amount of “weight” to each indicator, and this “weight” can influence adjacents price levels. These weightings mean that one price level without any indicator or moving average but under the influence of two “strongly weighted” levels accumulate more resistance than their neighbors. In these cases, the tool signals resistance in apparently empty areas.
