- The AUD/USD pair maintains a bearish bias despite the current rebound.
- It could retest the immediate support levels before jumping higher again.
- Only a valid breakout above the downtrend line may activate a larger rebound.
The AUD/USD price rallied in the short term as the USD was weakened by DXY’s sell-off. Technically, the bias remains bearish, but a temporary rebound was somehow expected after its massive drop.
-Are you interested to find high leverage brokers? Check our detailed guide-
In the short term, the price action developed a potentially bullish pattern. Still, this formation is far from being confirmed. The price may only reach the immediate upside obstacles before turning to the downside.
Fundamentally, the Australian Building Approvals rose by 9.9% versus a 2.0% drop expected, ANZ Job Advertisements surged by 1.4%, while the MI Inflation Gauge registered a 0.3% growth.
Today, the US banks are closed in observance of Independence Day.
Tomorrow, the RBA Rate Statement and the Cash Rate could bring high volatility and sharp movements on either side. Also, the Australian Retail Sales, AIG Construction Index, and the US Factory orders could bring more volatility.
The AUD/USD pair also dropped a little in the short term because the US ISM Manufacturing PMI, Construction Spending, ISM Manufacturing Prices, and the Wards Total Vehicle Sales came in worse than expected on Friday.
DXY price technical analysis: Correction
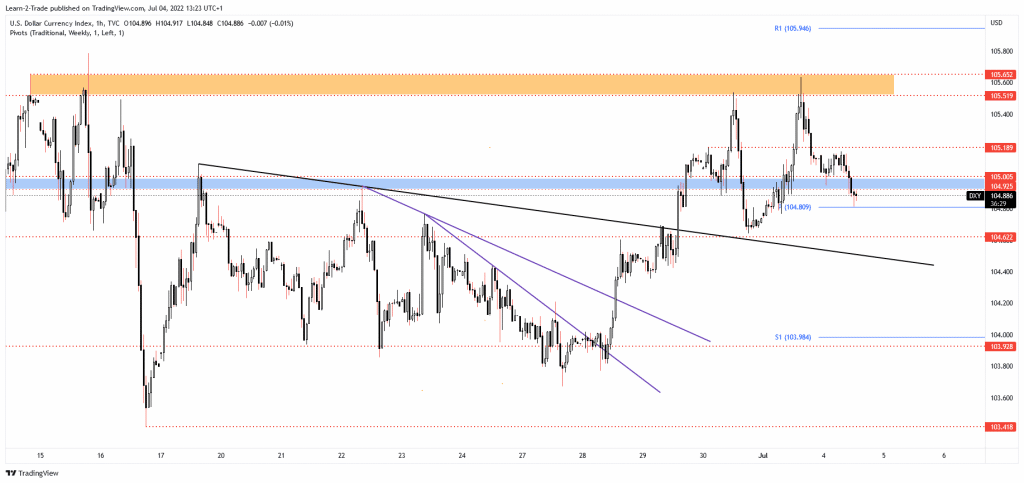
As you can see on the 1-hour chart, the Dollar Index retreated after reaching a resistance zone. The current drop forced the USD to lose significant ground versus the other currencies. The DXY maintains a bullish bias despite temporary drops. It could reach and retest the immediate downside obstacles before coming back higher.
-Looking for high probability free forex signals? Let’s check out-
AUD/USD price technical analysis: Surging towards trendline
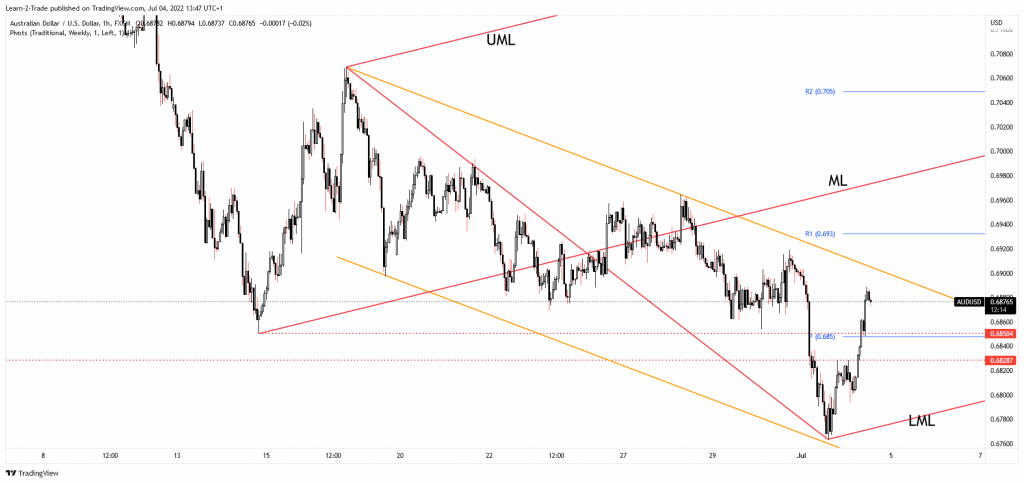
The AUD/USD pair climbed as much as 0.6888, where it found resistance. It almost reached the downtrend line, which represents a dynamic resistance. Now, it could come back to test and retest the 0.6850 key level and the weekly pivot point (0.6850).
The 0.6828 level is seen as a downside obstacle as well. A larger swing higher could be activated only by a valid breakout above the downtrend line. Only false breakouts above this obstacle or failing to reach it may signal a new sell-off.
Looking to trade forex now? Invest at eToro!
68% of retail investor accounts lose money when trading CFDs with this provider. You should consider whether you can afford to take the high risk of losing your money
