- AUD/USD bounces off fresh eight-day low of 0.6809.
- Sellers cheer the break below mid-January top to visit an ascending trend line from March 19.
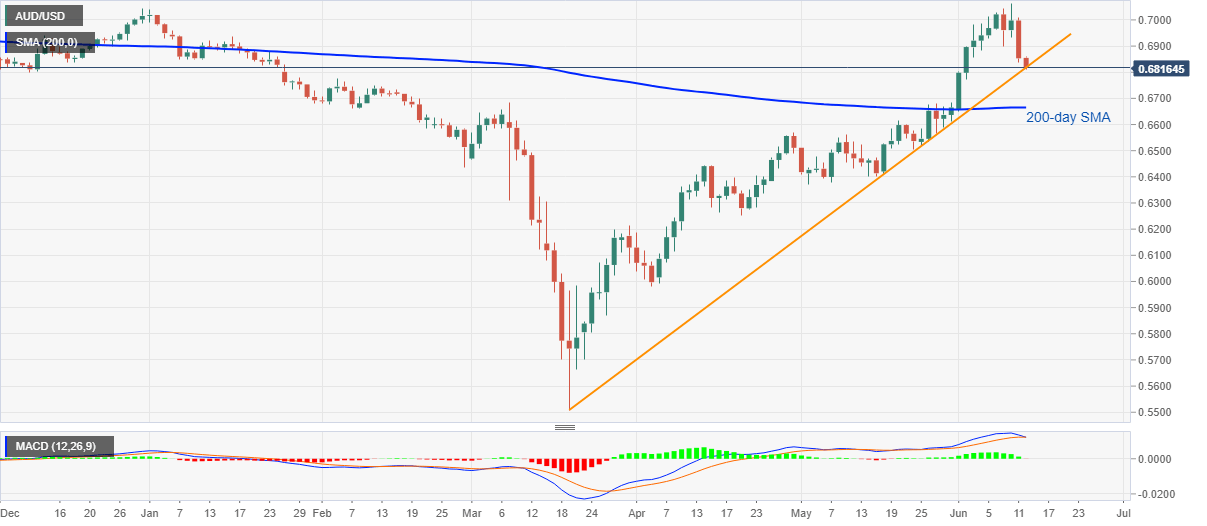
- 200-day SMA offers additional support during further downside.
AUD/USD drops to the near-term key support line while taking rounds to 0.6820 amid the Asian session on Friday. The Aussie pair prints a 0.50% loss despite recovering from the lowest point since June 02.
Even if the immediate trend line support questions the bears, the quote’s sustained trading below the mid-January top, as well as MACD conditions, seem to favor the sellers. It should be noted that the MACD histogram is flirting with bulls after a month as we write.
As a result, traders are waiting for a clear break below 0.6815 support line to extend the fall. In doing so, the 200-day SMA level of 0.6665 becomes important to watch. Though, February month high of 0.6775 might act as an intermediate support.
In a case whereas the AUD/USD prices take a U-turn from current levels, buyers will wait for a clear run-up past-0.6935 before entering any fresh positions.
Should there be a sustained rise beyond 0.6935, 0.7000 and the latest high around 0.7065 might lure the bulls.
AUD/USD daily chart
Trend: Pullback expected
