- The aussie’s path of least resistance appears to the upside.
- The spot charts falling channel breakout on hourly sticks.
- Extension of the USD sell-off could risk a test of 0.72 in AUD/USD.
AUD/USD has receded from daily highs of 0.7146 but still trades with sizeable gains above 0.7100 amid broad US dollar weakness and US-China escalation over the consular closure.
From a short-term perspective, the spot has dived out of the falling channel on the hourly chart, calling for a test of the target pattern around 0.7235 levels in the coming days.
On its way to the said target, the spot will face initial resistance at 0.7183 (15-month tops), beyond which the 0.7200 round numbers could be tested.
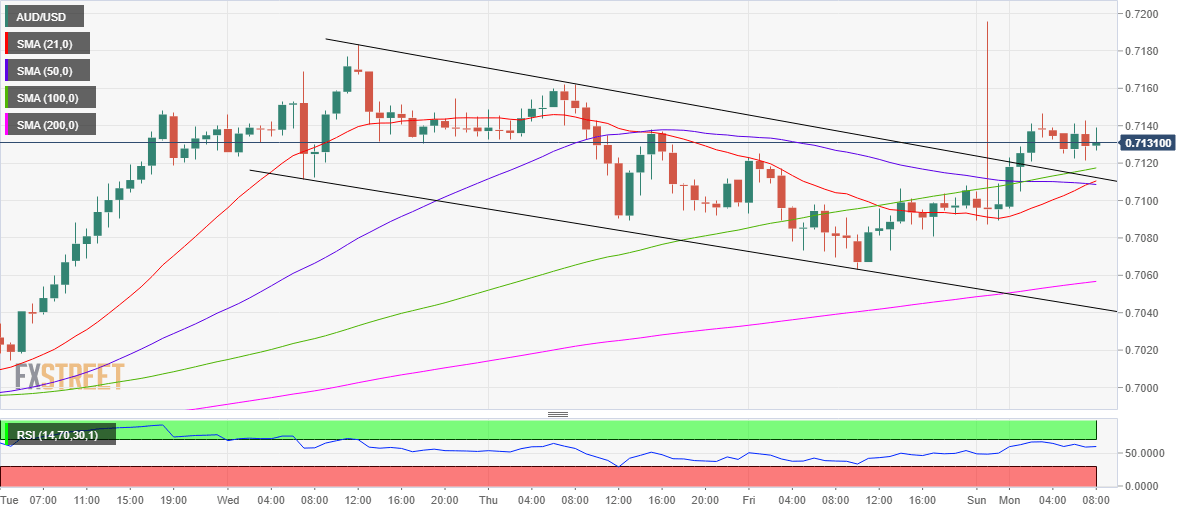
On the flip side, the immediate cushion is seen at 0.7116, the bullish 100-hourly Simple Moving Average (HMA), a break below which will put the next key support around 0.7110 at risk. That zone is the confluence of the 21, 50-HMAs and falling trendline resistance-turned-support.
Should the bulls fail to defend the above-mentioned support, the near-term bullish bias could weakness subsequently. The hourly RSI trades flat but in the bullish territory, backing the case for the further upside.
AUD/USD hourly chart
AUD/USD additional levels
