- AUD/USD bears taking back the control and eye weekly old resistance.
- There is a period of consolidation expected around and below current short term resistance.
AUD/USD is overstretched according to the following analysis that illustrates where the next downside opportunity may come.
Monthly
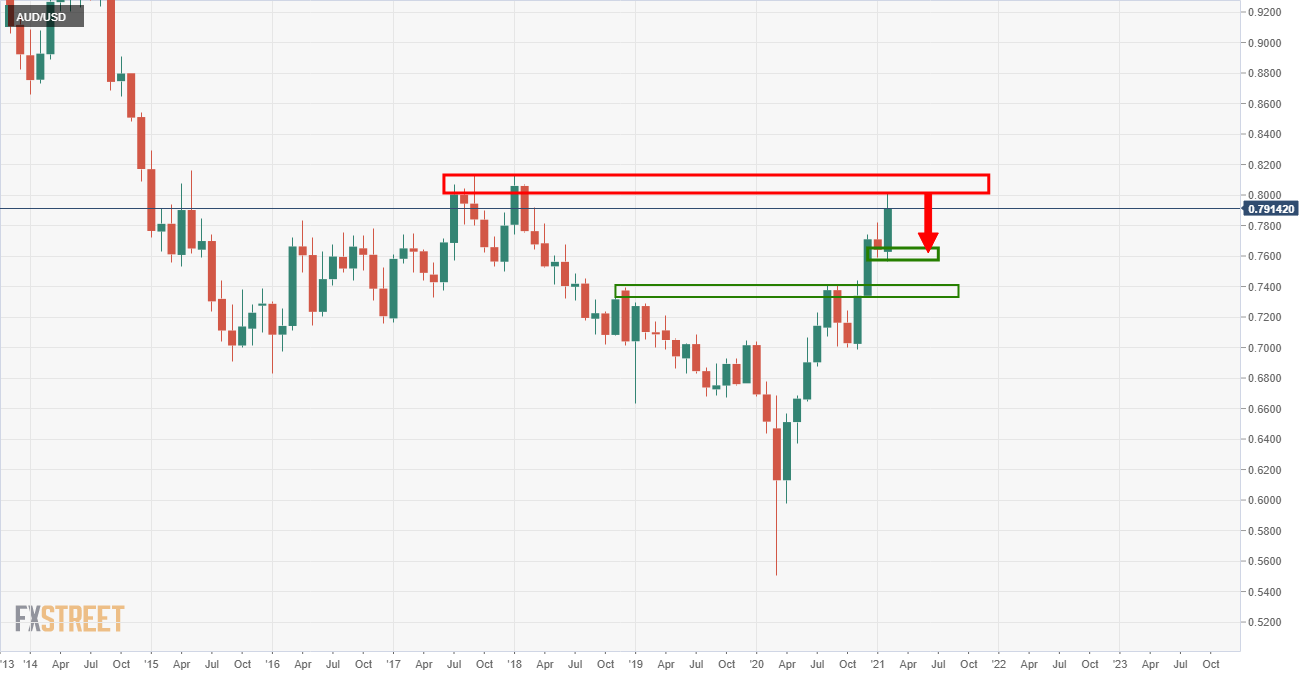
The monthly chart shows that the price is testing a deep resistance area.
Failures here open risk to a significant move to the downside to test prior resistance, at least.
Weekly
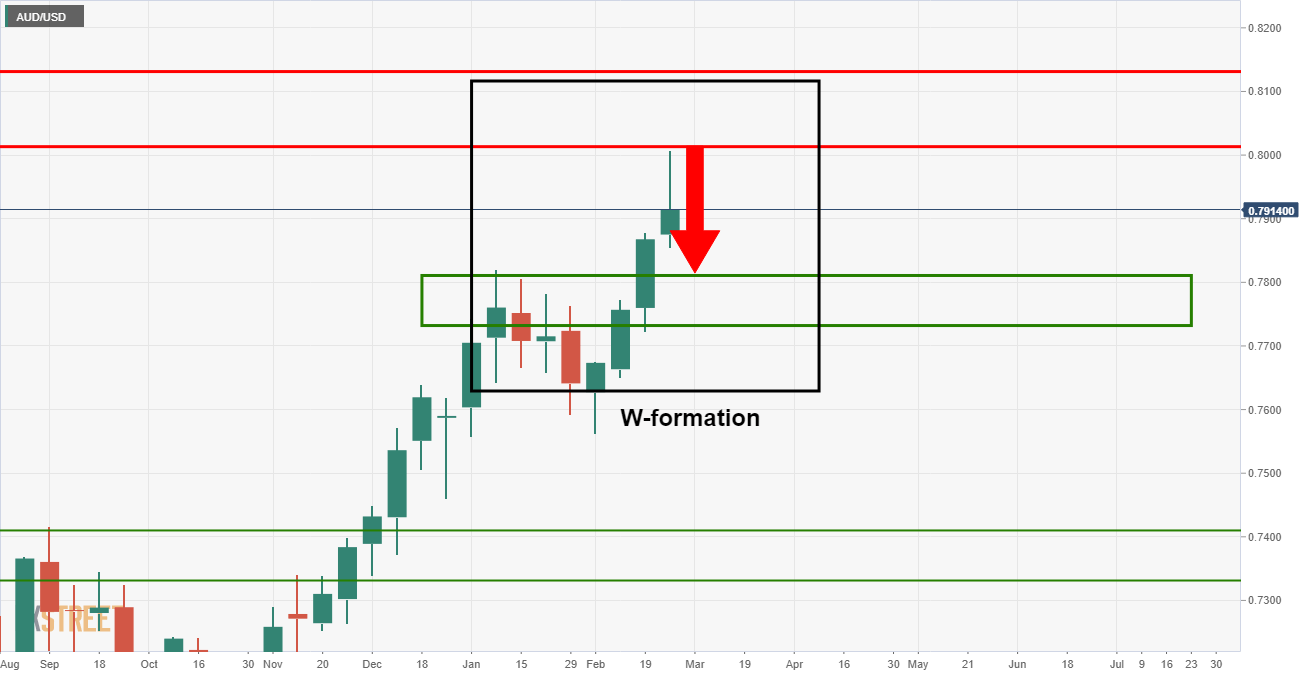
The weekly W-formation is a bearish pattern and the price would be expected to reach at least the neckline.
Daily
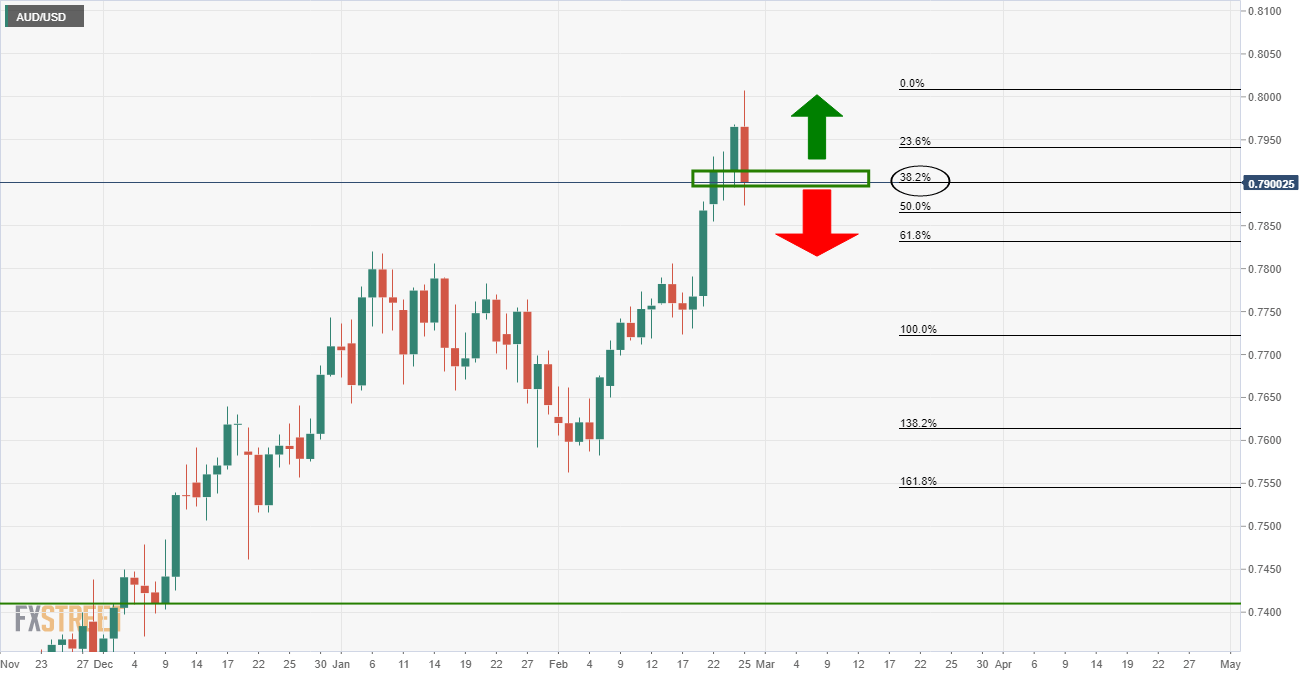
The daily chart shows that the price is already testing an old resistance for which failures below it will usually equate to an extension to the weekly and monthly area of old resistance.
A 61.8% Fibonacci of the latest bullish impulse has a confluence with old weekly highs.
4-hour chart
The price is testing a critical support zone that may now act as resistance.
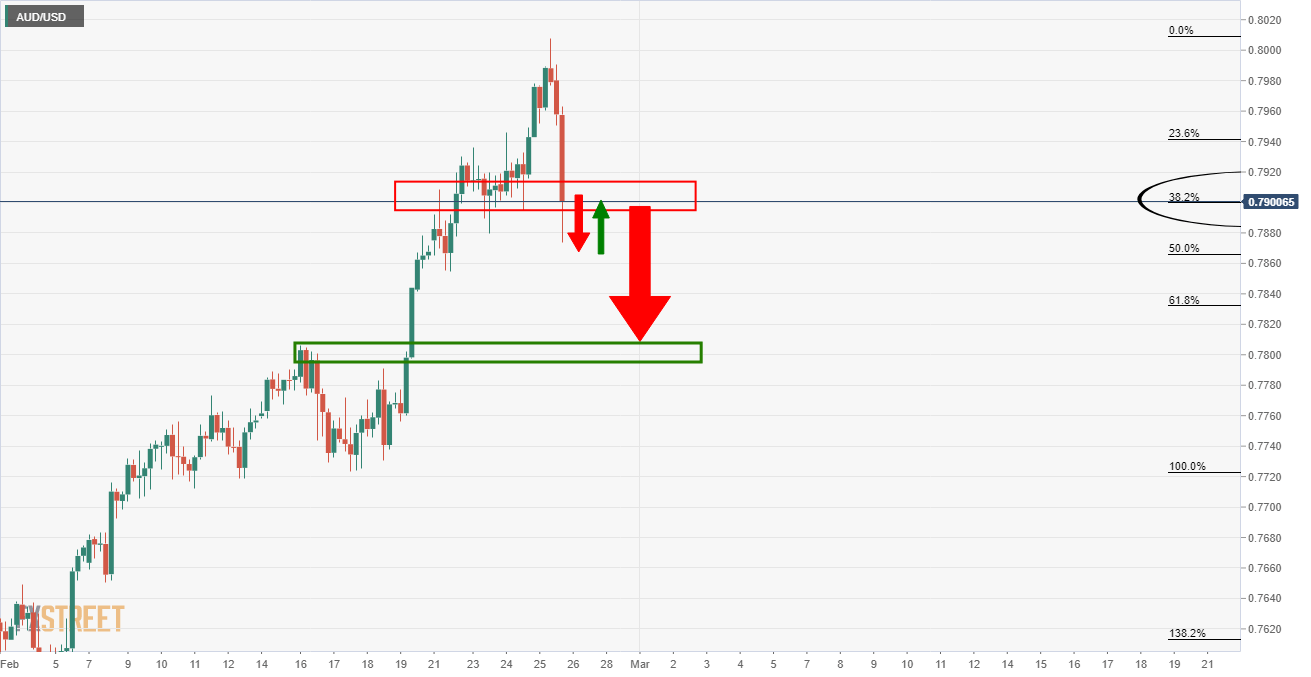
1-hour chart
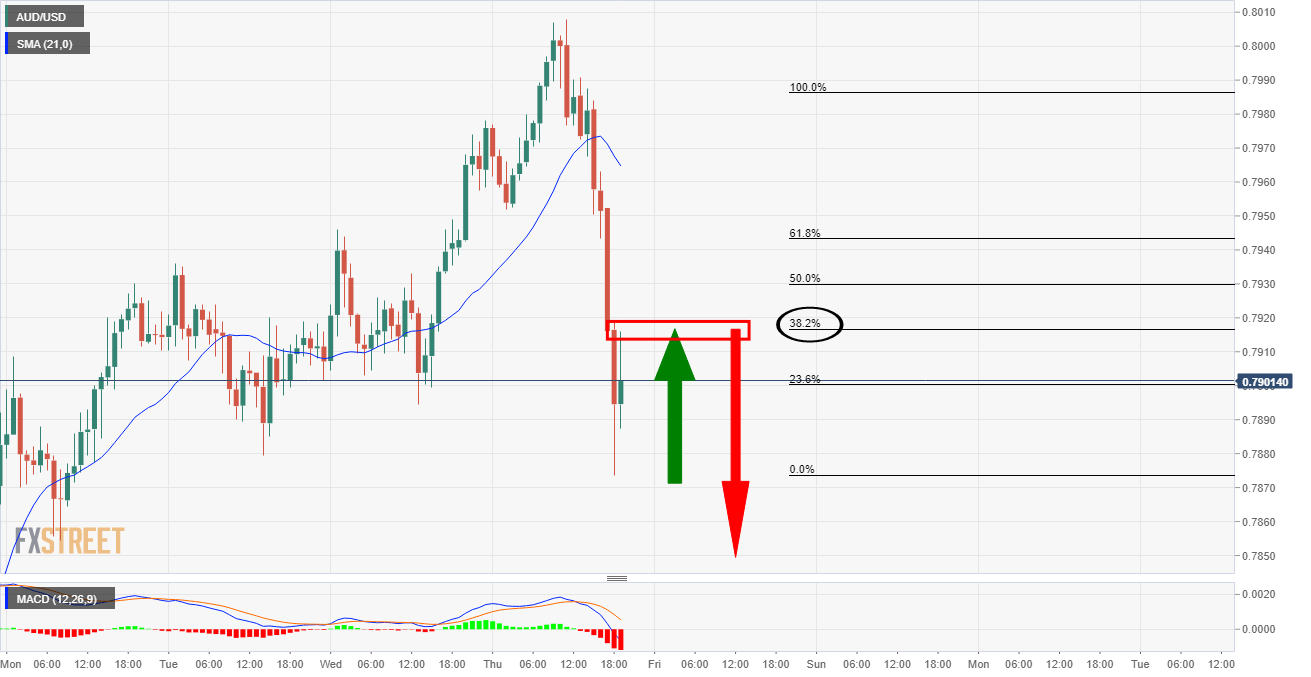
The hourly chart is testing the 38.2% Fibonacci resistance and a downside extension of the bearish impulse would be in anticipation following failures at this juncture.
15-min chart
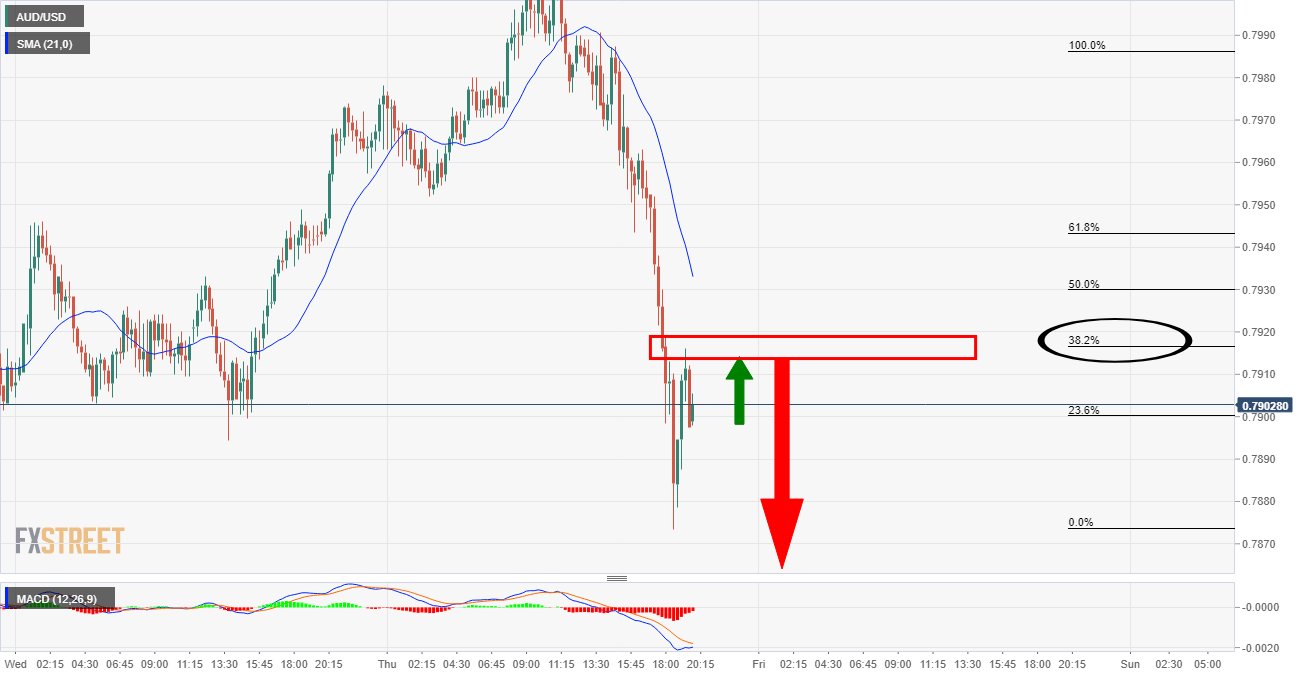
The 15-min chart’s conditions are bearish and it may only be a matter of a series of further failures over the coming sessions and month-end at the resistance for the market to melt.
