- AUD/USD’s daily chart shows a bullish continuation pattern.
- The pair could soon challenge September highs above 0.74.
AUD/USD is currently trading near 0.7370, representing a 0.20% gain on the day, having found bids near 0.7350 early today.
The pair is gaining altitude in the wake of an ascending triangle breakout (bullish continuation pattern) confirmed on Tuesday.
Backing the breakout are rising 5- and 10-day Simple Moving Averages and an above-50 or bullish reading on the 14-day Relative Strength Index.
As such, the pair could soon test resistance at 0.7413 (Sept. 1 high). A close under the 10-day SMA, currently at 0.7324, would invalidate bullish bias.
Daily chart
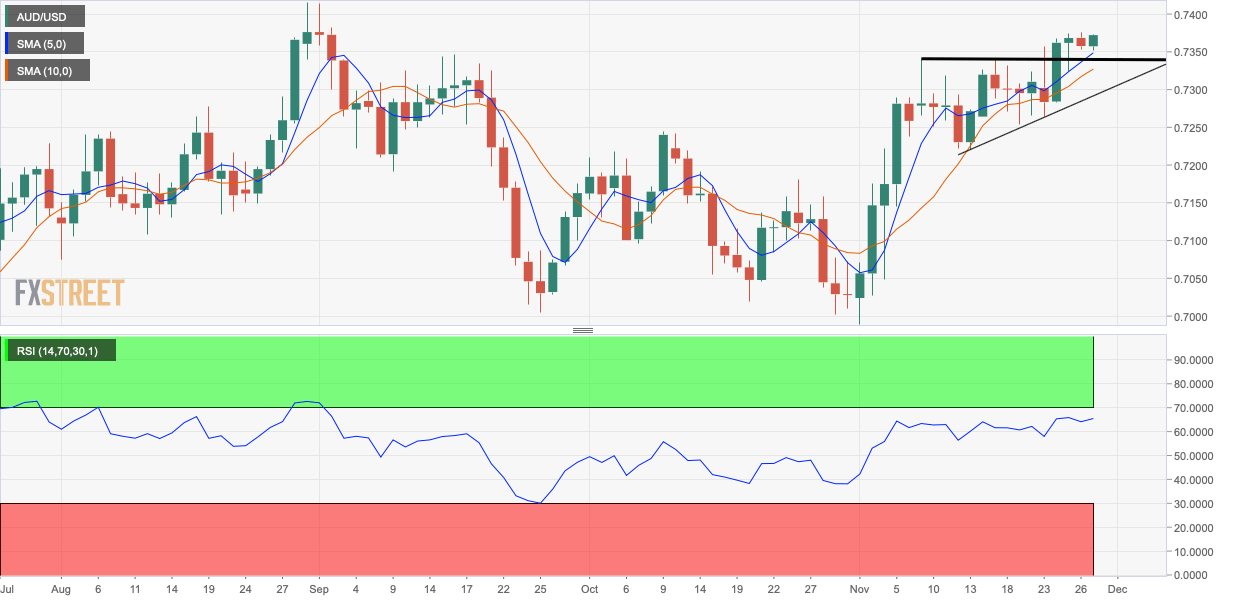
Trend: Bullish
Technical levels
