- AUD/USD monitored for a bullish breakout of the symmetrical daily triangle.
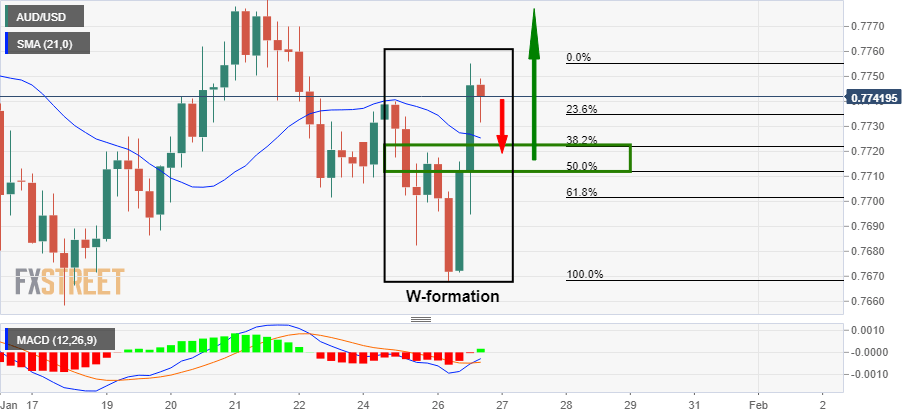
- 4-hour W-formation’s neckline will be eyed for a test and a subsequent demand area with the triangle.
AUD/USD’s medium-term outlook is bearish considering the correction that is to be expected on the longer-term time frames following two consecutive months of bullish impulses.
Longer-term, there could still be more upside to follow from a healthy bearish correction.
Meanwhile, the current state of play is less clear, but the following top-down analysis unravels the price action and illustrates where the next trading opportunities could arise from within the market structure.
Monthly chart
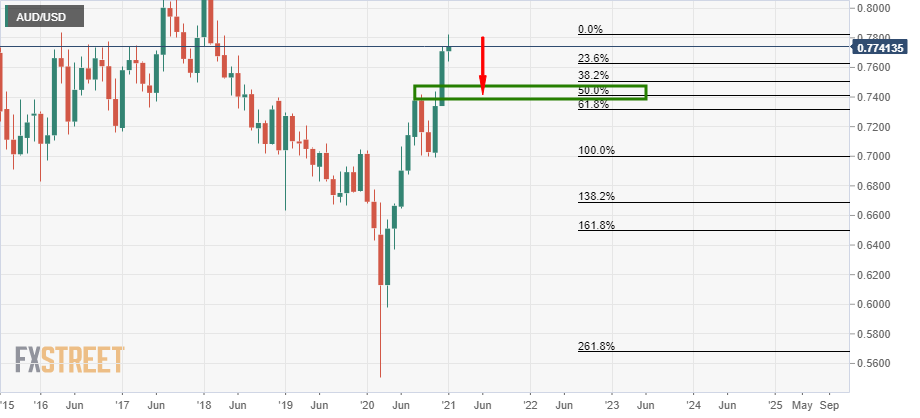
As can be seen, the bullish trend could be due for a correction towards old highs and the confluence of a 50% mean reversion.
Net AUD positions held in positive territory for a second week and could be trimmed and reflected in the spot market in the coming days and/or weeks.
However, that is not to say that a continuation in the spot market can be ruled out for there has been no sign of slowing momentum and the 2018 highs and presumed resistance towards 0.80 are still some way off yet.
Weekly chart
The weekly chart is somewhat less bullish as we are seeing signs that the trend is tiring from a closer inspection.
Ther is a demand area that could well be tested and it would be not surprising if it were to guard the monthly 50% mean reversion level.
Daily charts
The daily chart is a complex mix which is broken down into various parts as follows:
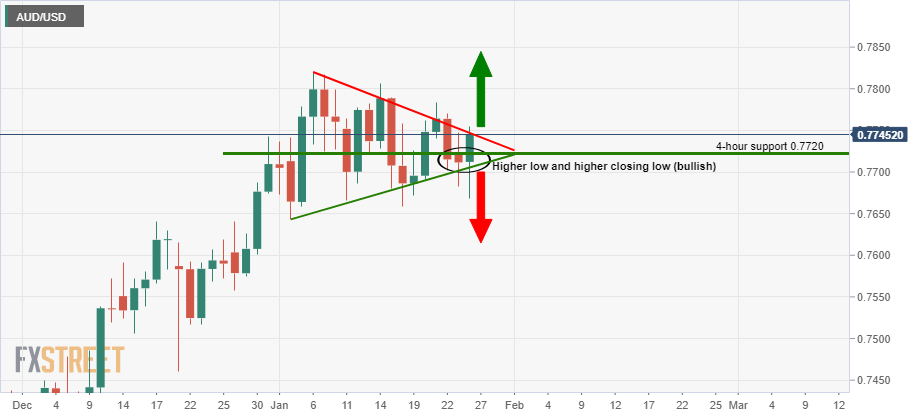
Overall, we are seeing a symmetrical triangle that could either act as a top or result in an upside continuation pattern:
The combination of the higher low and 4-hour support are explained below.
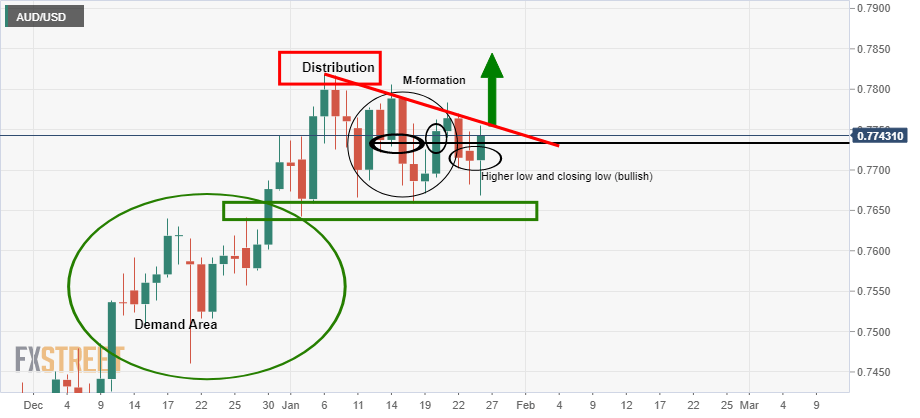
This is where the complexity of the market structure is broken down. In the above chart, we are seeing where the price is being sold by sellers in a phase of distribution by the less committed bulls.
The price action then resulted in an M-formation. After an M-formation the price is expected to retest the neckline of the M-formation which usually coincides with a 38.2% or 50% Fibonacci retracement level as a confluence.
The confluence would be expected to result in resistance. However, in this case, it did not and the price went on to break the area and print a strong high.
The correction of this impulse resulted in a higher low a closing low. This means that buyers are active and leaves a bullish bias on the charts.
A subsequent break of trendline resistance would be expected to result in a fresh daily impulse to the upside.
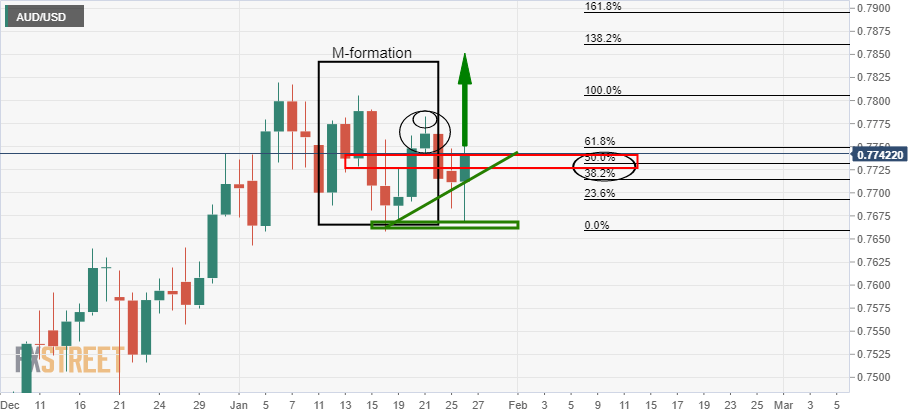
The following is a chart that illustrates the M-formation more clearly:
Note the strong high through the neckline as well as the supportive trendline of the correction and bullish bias.
4-hour chart
Meanwhile, there is a bearish bias on the lower time frames.
Bulls may need to wait for the test of the W-formation’s neckline and 21 moving average on the 4-hour chart at 0.7720 with a confluence of the 38.2% or 50% Fibonacci retracement levels.
A subsequent hold there would reinforce the upside bias and bullish breakout of the daily symmetrical triangle.
