- AUD/USD bulls continue with their northerly trajectory in a strong monthly rally.
- Bears will be looking for an opportunity to fade the moves across various time frames.
AUD/USD is relentless in its pursuit for blue skies and has recently printed fresh bullish cycle highs of 0.7554, trading some 0.2% up for the Asian session.
The following is a top-down analysis tracking the pair across multiple longer-term time frames firn which traders can assess for the next swing trading opportunity.
AUD/USD monthly chart
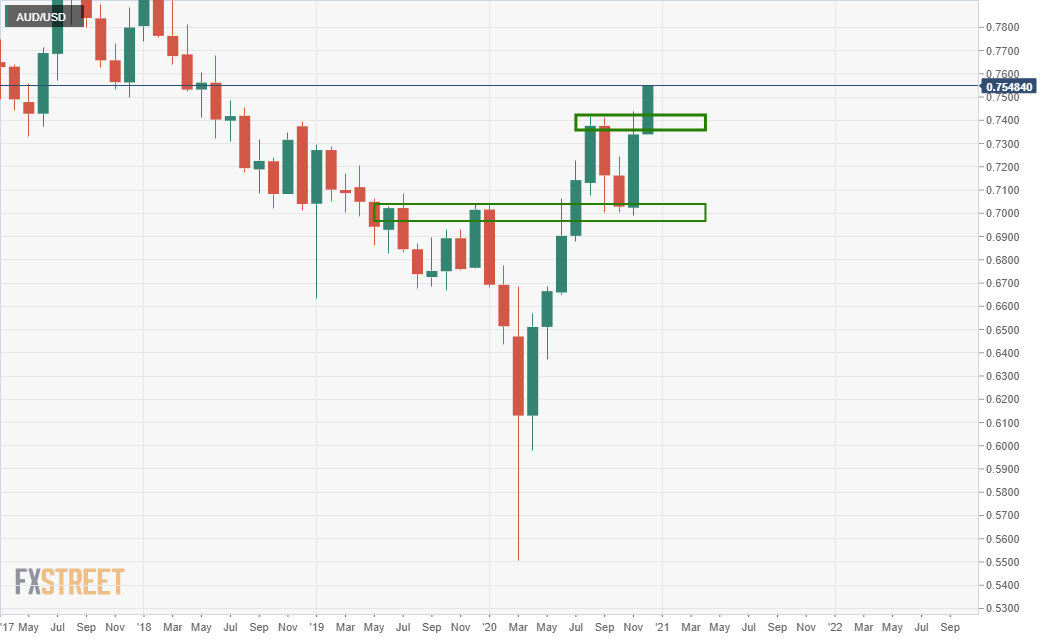
The monthly chart shows that the price has extended above the prior breakout structure and will have formed new support at the prior corrective highs.
AUD/USD Weekly chart
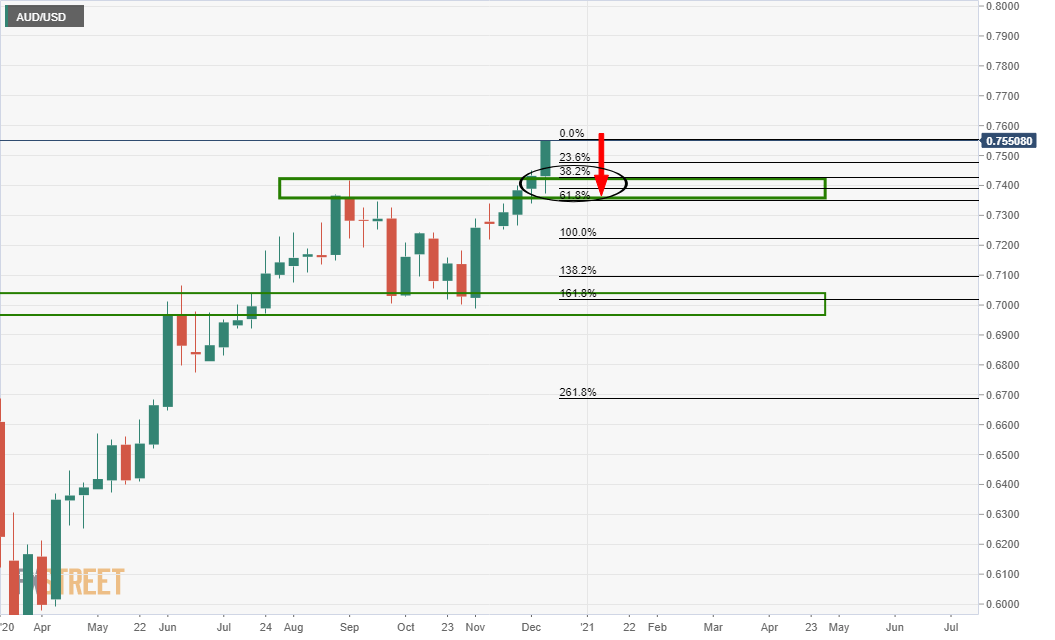
The weekly chart offers structure confluence with the 61.8% Fibo of the latest bullish impulse.
Daily chart

A meanwhile support zone meets the 38.2% Fibonacci retracement from current highs.
