- AUD/USD justifies the previous day’s bearish candlestick to trim weekly gains.
- 21-day, 50-day SMA add filters to the moves amid downbeat MACD.
- Monthly horizontal support becomes the key level to watch during heavy losses.
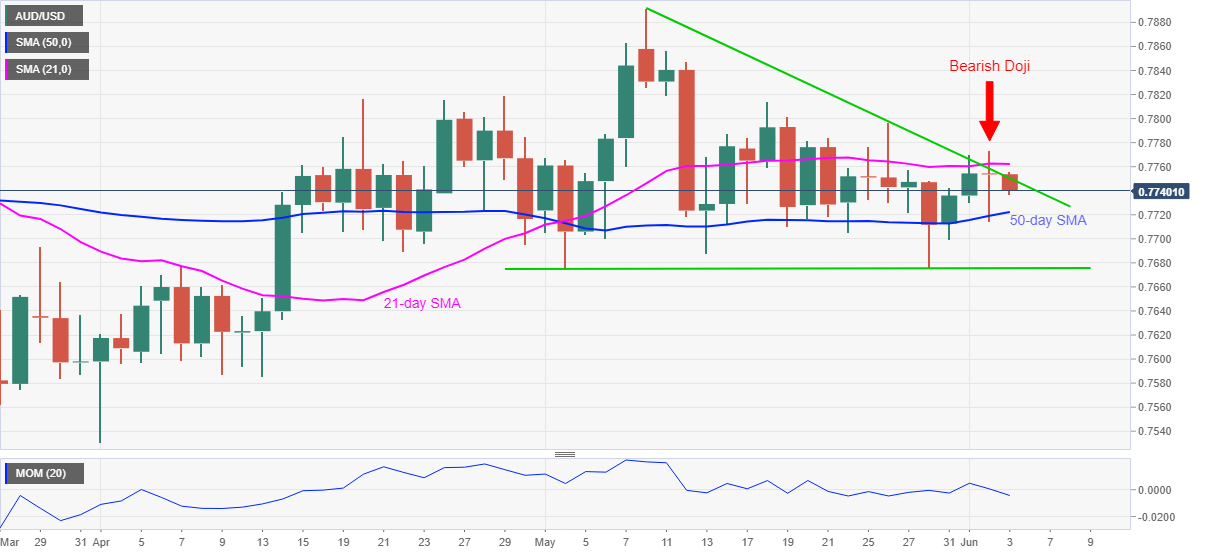
AUD/USD refreshes intraday low with 0.7736, down 0.20% on a day, while posting the heaviest losses in a week during Wednesday’s Asian session. In doing so, the Aussie pair takes bearish clues from Wednesday’s multiple catalysts suggesting further weakness in the prices.
Among them, the bearish Doji below 21-day SMA and failures to cross a three-week-old falling trend line takes the first place. The downbeat Momentum line adds to the bearish outlook.
However, a 50-day SMA near 0.7720 could test the intraday selling of AUD/USD ahead of directing them to an important horizontal line stretched from early May around 0.7675.
Meanwhile, AUD/USD bulls need a clear upside break of 0.7775 for the 0.7800 threshold and May 18 top near 0.7815.
In a case where the quote remains bullish after 0.7815, the previous monthly peak of 0.7892 and the 0.7900 round figure will be in focus.
Overall, AUD/USD remains inside a short-term descending triangle with a bearish bias for immediate moves.
AUD/USD daily chart
Trend: Further weakness expected
