- AUD/USD recovers from intraday low inside a bullish chart pattern.
- Sustained trading beyond 50-HMA, recovering Momentum also favor short-term buyers.
- 61.8% Fibonacci retracement can test the bearish ahead of the key 0.7560-55 support holding the gate for bearish H&S.
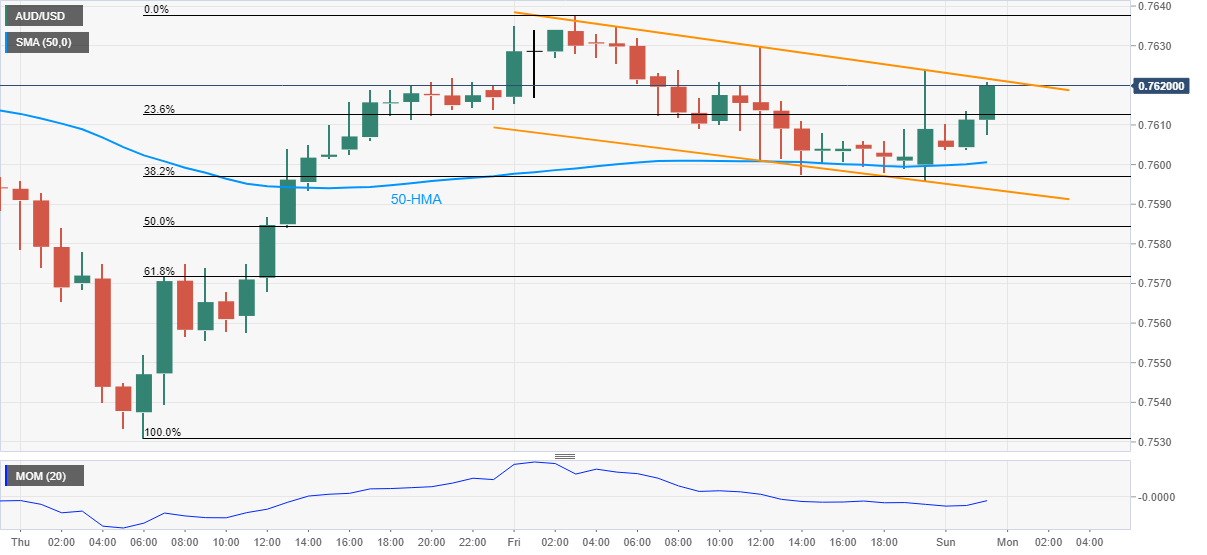
AUD/USD rises to 0.7616, up 0.08% intraday, during Monday’s Asian session. In doing so, the aussie pair takes the bids inside a bullish flag chart pattern on the hourly (1H) play.
Given the recovery in Momentum indicator and the pair’s sustained trading beyond 50-HMA, AUD/USD is likely to confirm the bullish chart formation by a clear break above 0.7625 hurdle.
Although AUD/USD buyers can theoretically target a 100-pip upside beyond 0.7625 on a successful breakout, March 29 top of 0.7693 can offer an intermediate halt during the rise.
Meanwhile, 50-HMA and flag’s support line, respectively around 0.7600 and 0.7590, restrict the short-term downside of the AUD/USD prices.
In a case where the quote drops below 0.7590, the 61.8% Fibonacci retracement of early April run-up, near 0.7570, can test the AUD/USD bears.
It should, however, be noted that the AUD/USD weakness past-0.7570 should be watched closely as it will challenge the key 0.7560-55 support zone comprising neckline of the head-and-shoulders (H&S) bearish formation on the daily chart.
AUD/USD hourly chart
Trend: Further recovery expected
