- AUD/USD bulls brace for another leg higher.
- Bullish crossover confirmed on the 1H chart.
- Bullish hourly RSI and Aussie Q# GDP beat support.
AUD/USD trades better in early Europe, consolidating the rally to two-day highs of 0.7391, reached in response to broad-based US dollar sell-off and upbeat Australian Q3 GDP.
Australia’s economy expanded by 3.3% in Q3, rebounding from its first recession in nearly three decades induced by the pandemic-related shocks.
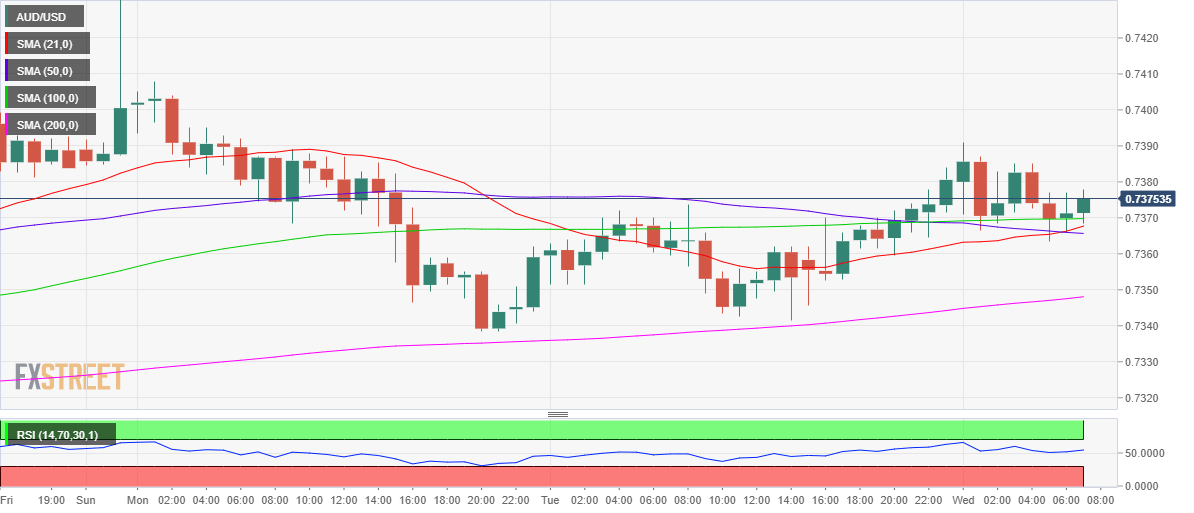
The price spotted a bullish crossover on the hourly sticks in the last hour, with the 21-hourly moving average (HMA) crossing above the 50-HMA. The bullish formation points to the additional upside in the major.
The hourly Relative Strength Index (RSI) points higher above the midline, currently at 54.01, backing the upbeat momentum. Therefore, a retest of the 0.7400 level is likely on the cards.
The next relevant upside target is seen at $0.7437, multi-month tops.
On the flipside, an immediate downside remains cushioned by the 50-HMA at 0.7365. Selling pressure could intensify below the latter, exposing the horizontal 200-HMA at 0.7348.
AUD/USD: Hourly chart
AUD/USD: Additional levels
