- AUD/USD staged a goodish intraday bounce from the vicinity of the 0.7600 mark.
- Sliding US bond yields undermined the USD and extended some support to the pair.
- The near-term technical set-up still seems tilted firmly in favour of bearish traders.
The AUD/USD pair recovered around 30-35 pips from the 0.7600 neighbourhood and was last seen trading with modest losses, just below mid-0.7600s.
The US dollar struggled to preserve its intraday gains amid sliding US Treasury bond yields. This, in turn, was seen as a key factor that extended some support to the AUD/USD pair. That said, a weaker opening in the US equity markets kept a lid on any strong gains for the perceived riskier aussie.
From a technical perspective, the post-RBA uptick on Tuesday faltered near the 0.7660-65 supply zone. The subsequent downfall shifted the near-term bias back in favour of bearish traders. However, the emergence of some dip-buying warrants some caution before positioning for any further declines.
Meanwhile, technical indicators on hourly charts have again started moving into the positive territory but are yet to confirm a bullish bias on the daily chart. Hence, a sustained move beyond the 0.7660-65 region is needed to confirm that the AUD/USD pair might have already bottomed in the near term.
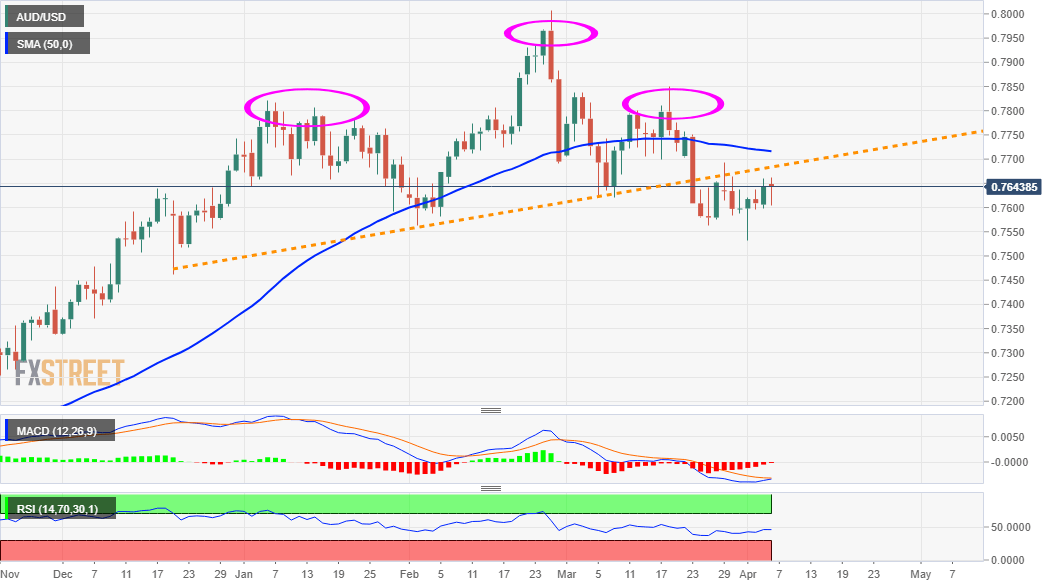
Looking at the broader picture, the mentioned barrier coincides with a bearish head-and-shoulders neckline support breakpoint. Repeated failures near the support-turned-resistance favour bearish traders and supports prospects for an extension of an over one-month-old downward trajectory.
A convincing break below the 0.7600 mark will reaffirm the bearish outlook and turn the AUD/USD pair vulnerable to slide back towards YTD lows, around the 0.7530 region. Bears might then drag the pair further to the 0.7500 psychological mark en-route the next relevant support near the 0.7460 region.
Conversely, some follow-through buying beyond the 0.7660-65 region, which now coincides with the 50-day SMA, might trigger a short-covering move. The AUD/USD pair might then accelerate the recovery move and aim back to reclaim the 0.7700 mark before climbing to the 0.7755-60 heavy supply zone.
AUD/USD daily chart
Technical levels to watch
