- AUD/USD pulls back from the two-week top.
- Bullish MACD, sustained recovery from 0.5510 keep buyers hopeful.
- 38.2% Fibonacci retracement can offer an additional filter to the downside.
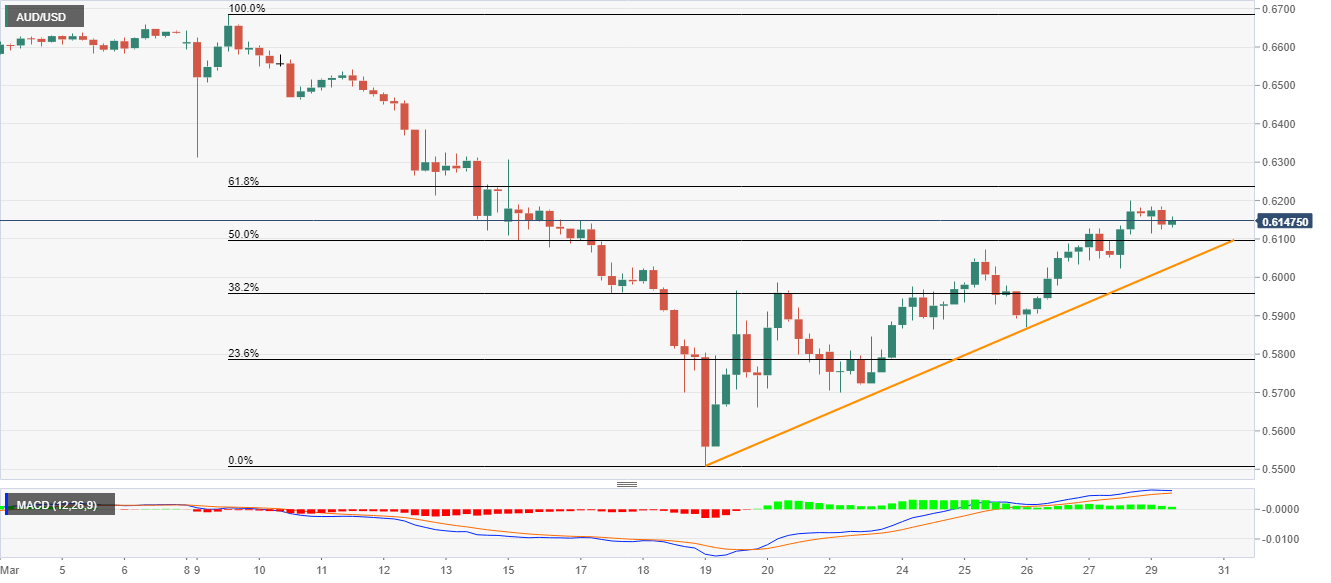
Despite following the seven-day-old rising trend line, AUD/USD stays below 61.8% Fibonacci retracement of March 09-19 fall while taking rounds to 0.6145 amid early Monday.
Given the bullish MACD and short-term rising trend line, the pair is anticipated to extend the run-up and hence a clear break of 61.8% Fibonacci retracement level of 0.6236 could push the buyers towards March 13 tops near 0.6320.
During the pair’s run-up beyond 0.6320, 0.6460 can offer an intermediate halt to the monthly top surrounding 0.6670.
On the downside, a clear break below 0.6030 support line can take rest on 38.2% Fibonacci retracement near 0.5955.
However, the pair’s sustained declines below 0.5955 might not refrain to aim for one-week low near 0.5700.
AUD/USD four-hour chart
Trend: Further recovery expected
