- AUD/USD is priming for a short below daily support and towards a key weekly moving average.
- The price is in a phase of distribution which offers both downside and upside swing trading opportunities.
The following flow of top-down analysis illustrates where the next trading opportunity to the downside might arise on a break of daily support.
The monthly, weekly and daily charts are used to identify the opportunities in the chaos of the volatility in AUD/USD.
For this particular scenario, the weekly chart is offering the most compelling medium-term trading outlook.
Monthly chart
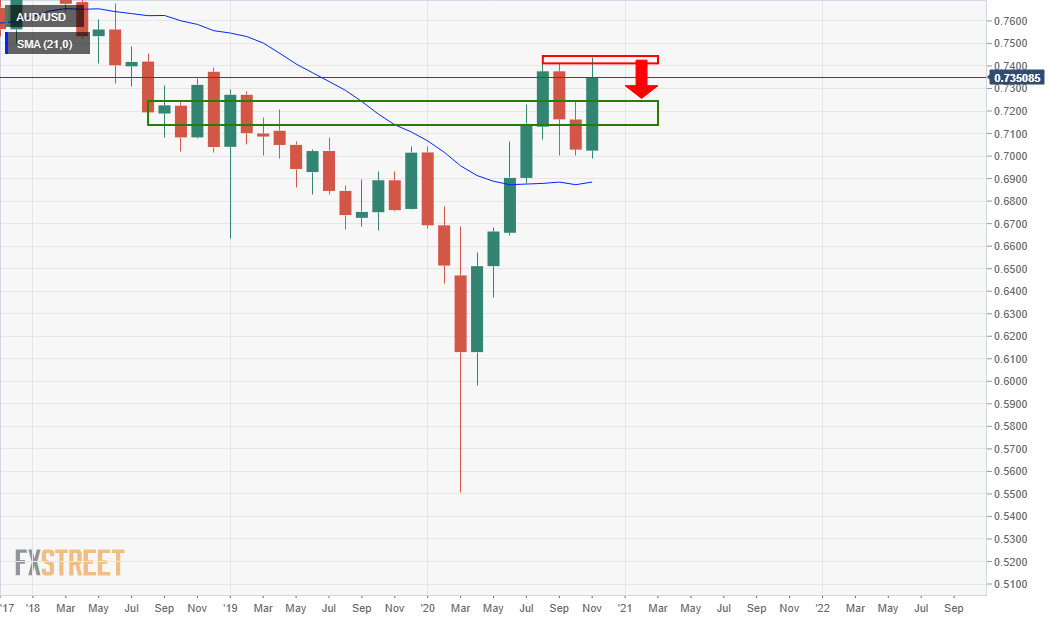
Bears are lurking within a phase of the distribution following a strong monthly surge to the upside.
Weekly chart
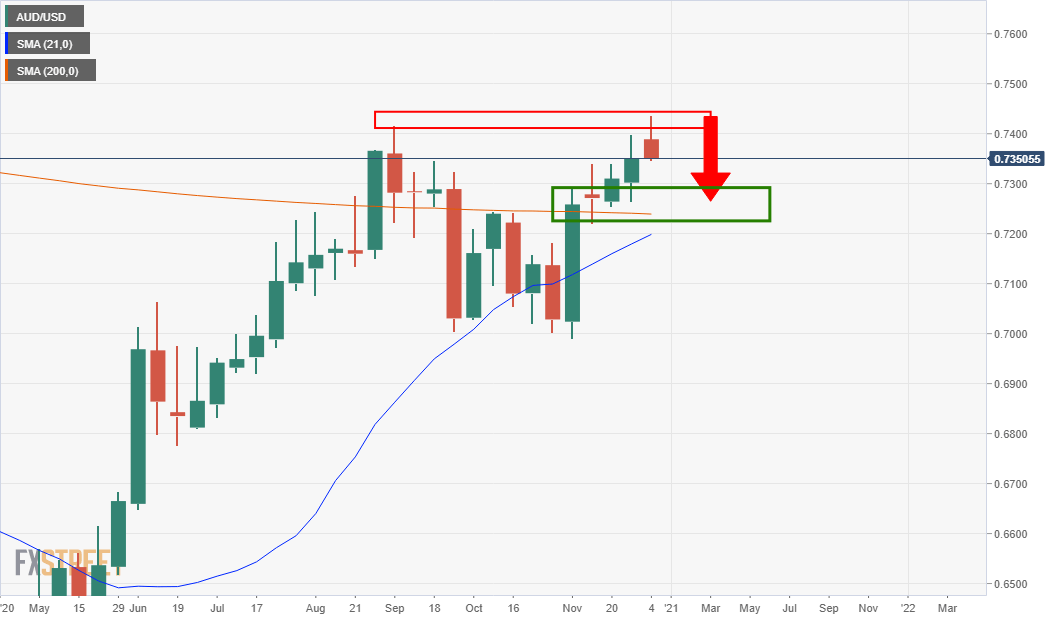
The resistance is opening prospects for a run towards the 200-week moving average and correlation of the prior resistance and structure.
Daily chart
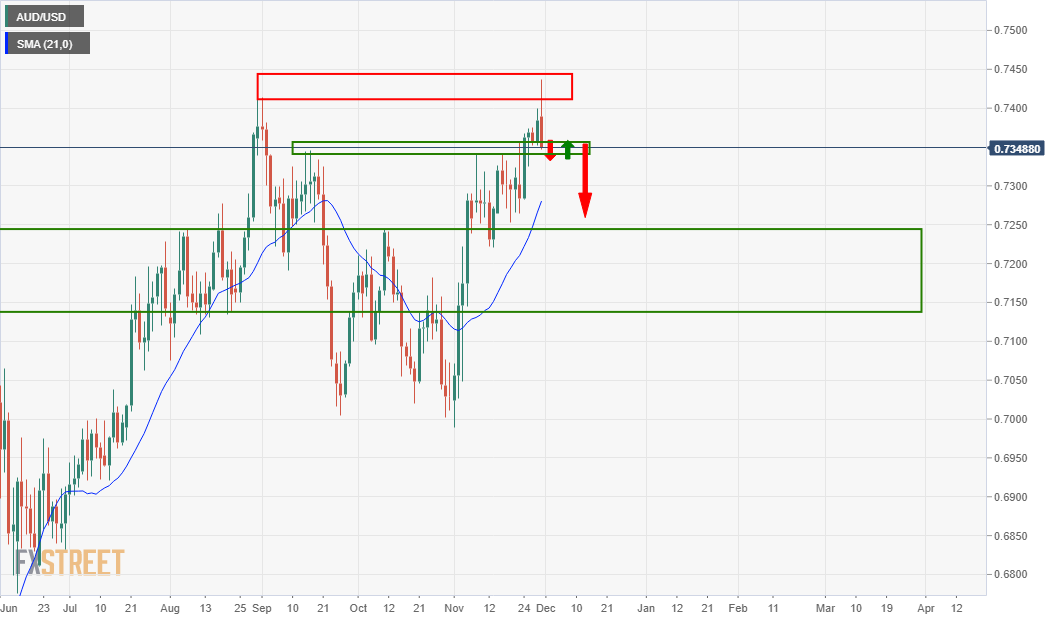
There is a problem on the daily chart, however.
There is a strong level of support from which price can easily bounce from.
Until the price breaks the support structure, then there is nothing here to do but monitor price, for the time being.
Hourly chart
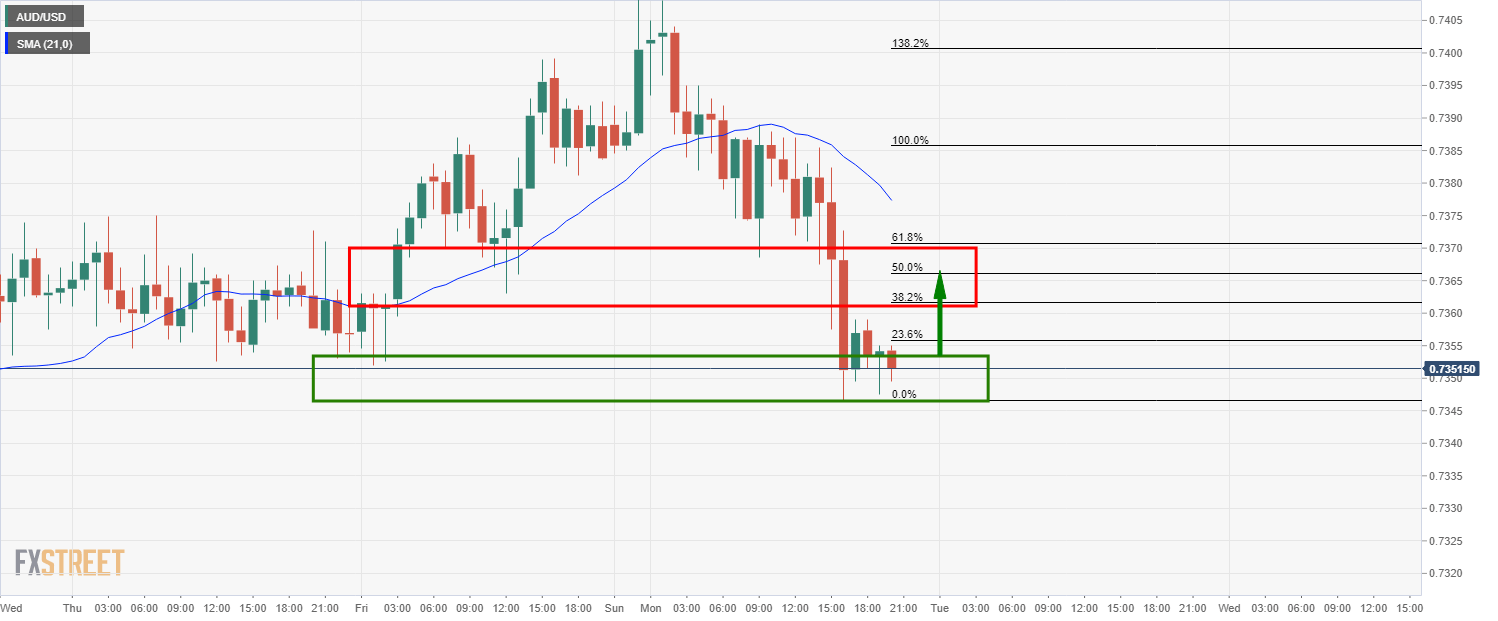
Meanwhile, the bears may need to wait for sometime before an opportunity on the daily chart arises for the price is in a period of accumulation.
Price would be expected to move up to test the hourly resistance and liquidity in the 50% mean reversion area prior to extending to the downside and breaking daily support.
