- The AUD/USD pair could register a new sell-off after making a valid breakdown below the sl1.
- Only a new higher high may signal an upside continuation.
- The US data could be decisive today.
The AUD/USD price is trading in the red at 0.7091, at the time of writing. As you already know, the price developed a significant swing higher as the Dollar Index is in a corrective phase.
–Are you interested in learning more about British Trade Platform Review? Check our detailed guide-
The DXY reached a support level, so a bounce-back could force the USD to recover against its rivals. After its strong depreciation, the US Dollar could try to take the lead again in the short term.
As you already know, the Federal Reserve is expected to continue hiking rates in the next monetary policy meeting as the inflationary pressure is high.
Fundamentally, the Australian data came in worse than expected compared to the last reporting period. The Flash Services PMI dropped from 56.1 to 53.0, while the Flash Manufacturing PMI came in at 55.3 in May, below 58.8 points in April. The economic indicators signaled that we have a slowdown in expansion in both sectors.
Later, the US data could be decisive, and the volatility could be high in the US session. The Flash Manufacturing PMI is expected to drop from 59.2 to 57.6 points, Flash Services PMI could come in at 55.1 points below 55.6 in the previous reporting period, while the New Home Sales indicator may drop from 763K to 751K.
AUD/USD price technical analysis: Overbought
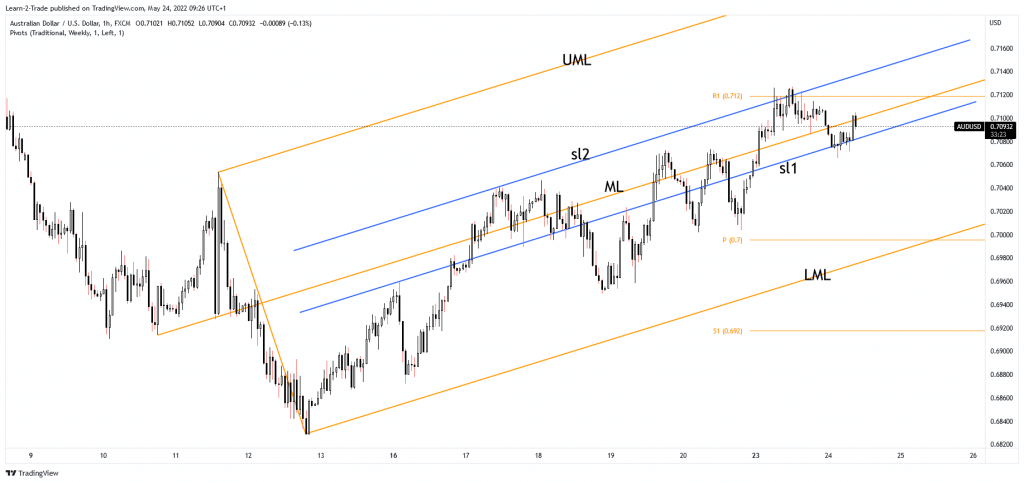
The AUD/USD pair plunged after failing to stabilize above the ascending pitchfork’s median line (ML). As you can see on the 1-hour chart, the price found resistance at the weekly R1 (0.7120) and at the upside inside the sliding line (sl2).
–Are you interested in learning more about buying NFT tokens? Check our detailed guide-
The price registered only a false breakout through the confluence area formed at the intersection between these upside obstacles. Technically, the downside sliding line (sl1) stands as a dynamic support.
Making a valid breakdown below it may signal a strong sell-off. In my opinion, only a valid breakout above the weekly R1 (0.7120), a new higher high could activate an upside continuation.
Looking to trade forex now? Invest at eToro!
68% of retail investor accounts lose money when trading CFDs with this provider. You should consider whether you can afford to take the high risk of losing your money
