- AUD/USD bounces off the six-week-old support line.
- 21 and 50-day EMA, coupled with 38.2% Fibonacci retracement limits near-term upside.
- Sellers can watch over 0.6700 following the downside break.
Following its drop to the weekly low, AUD/USD recovers from a multi-week-old support trend line while taking rounds to 0.6785 during early Friday.
Even so, buyers are likely finding it hard to extend the pullback beyond 0.6825/30 resistance confluence as it including 21/50-day Exponential Moving Averages (EMA) and 38.2% Fibonacci retracement of July-September declines. Increasing the downside bias are bearish signals by 12-bar Moving Average Convergence and Divergence (MACD) indicator.
That said, pair’s sustained break of 0.6830 might not refrain from challenging 50% Fibonacci retracement level of 0.6875 whereas 0.6900 and monthly high close to 0.6930 could entertain bulls during further advances.
On the contrary, sellers will look for fresh entry below an ascending support line stretched since October 09, at 0.6780 now. In doing so, a 23.6% Fibonacci retracement level of 0.6767 and 0.6735/30 can offer intermediate halts prior to fetching the quote to 0.6700 that nears multiple lows marked since late-August.
During the sellers’ dominance past-0.6700, October month low near 0.6670 can come back on the charts.
AUD/USD daily chart
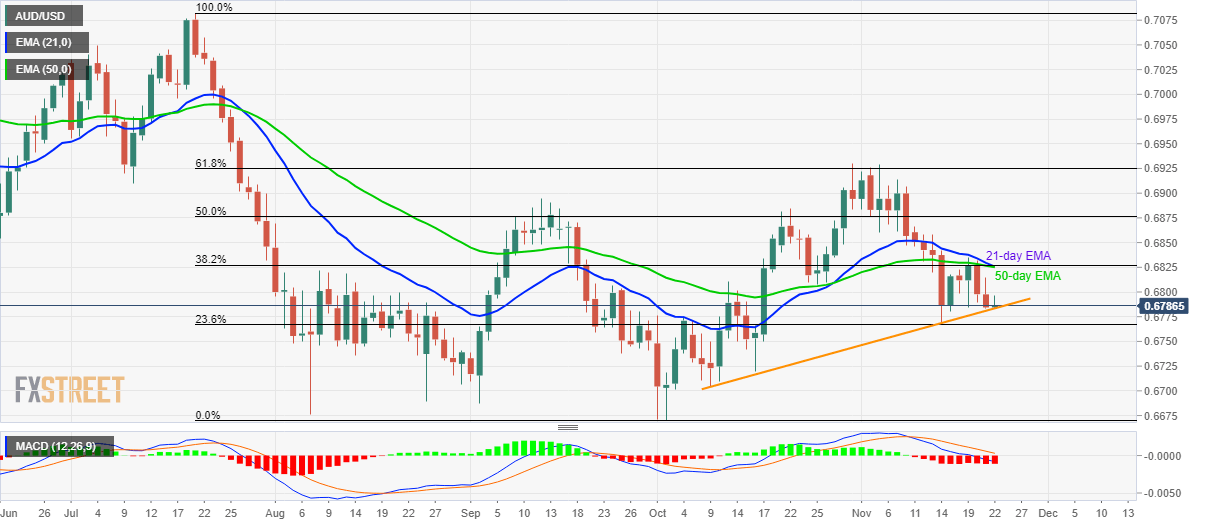
Trend: Bearish
