- AUD/USD is in a bear trend.
- AUD/USD bears broke below the 0.7200 figure while the RSI, MACD and Stochastics indicators are in negative territories. AUD/USD is trading below its 50, 100 and 200-period simple moving average (SMA) which leaves room for bulls to return to the mean. However, AUD/USD is also capped by the bearish trendline (blue) near 0.7255.
- The market is set to continue evolving sideways to down with any incursion above 0.7200 likely capped near 0.7255 (August 13 low) in the short-term.
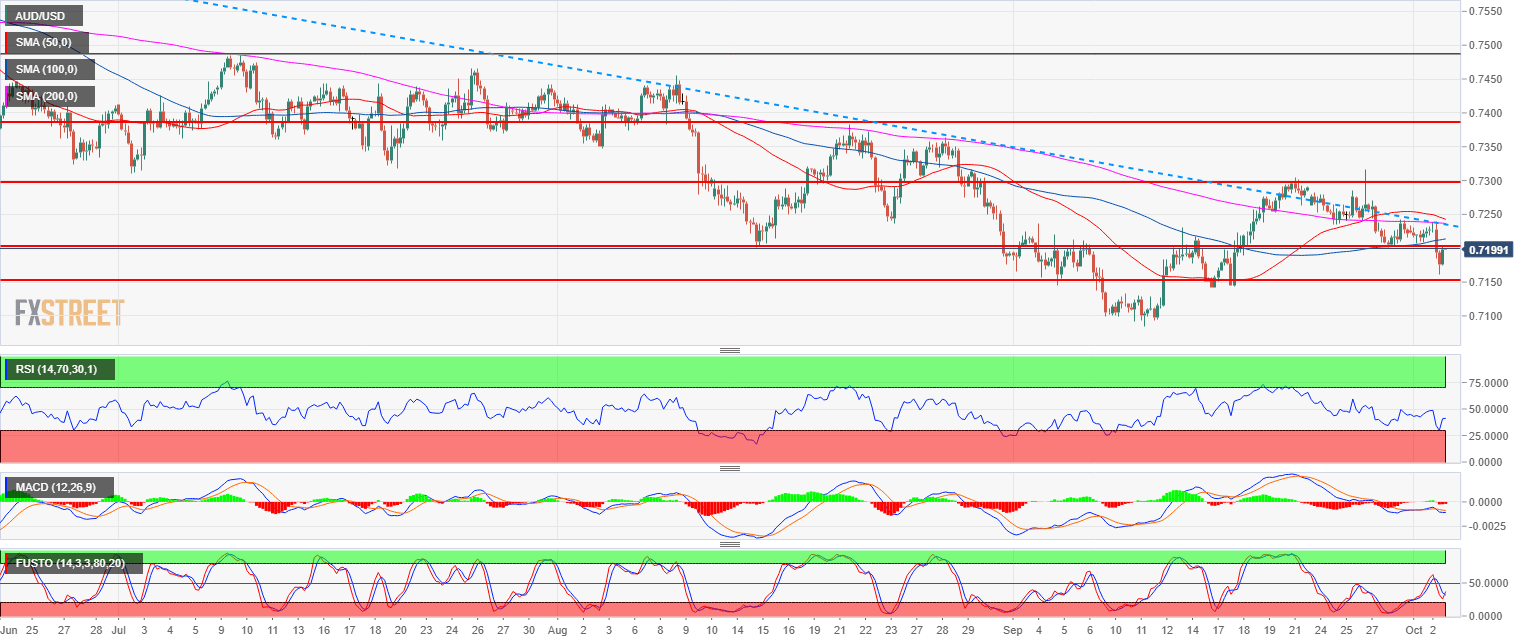
Spot rate: 0.7200
Relative change: -0.33%
High: 0.7240
Low: 0.7161
Main trend: Bearish
Resistance 1: 0.7200 figure August 15 low
Resistance 2: 0.7236 August 24 low
Resistance 3: 0.7255 August 13 low
Resistance 4: 0.7294-0.7307 August 13 high, 50 DMA
Resistance 5: 0.7383 August 21 high
Resistance 6: 0.7485 July 10 high
Support 1: 0.7144 September 5 low
Support 2: 0.7085, current 2018 low
Support 3: 0.7000 figure
Support 4: 0.6830 January 15, 2016 low
