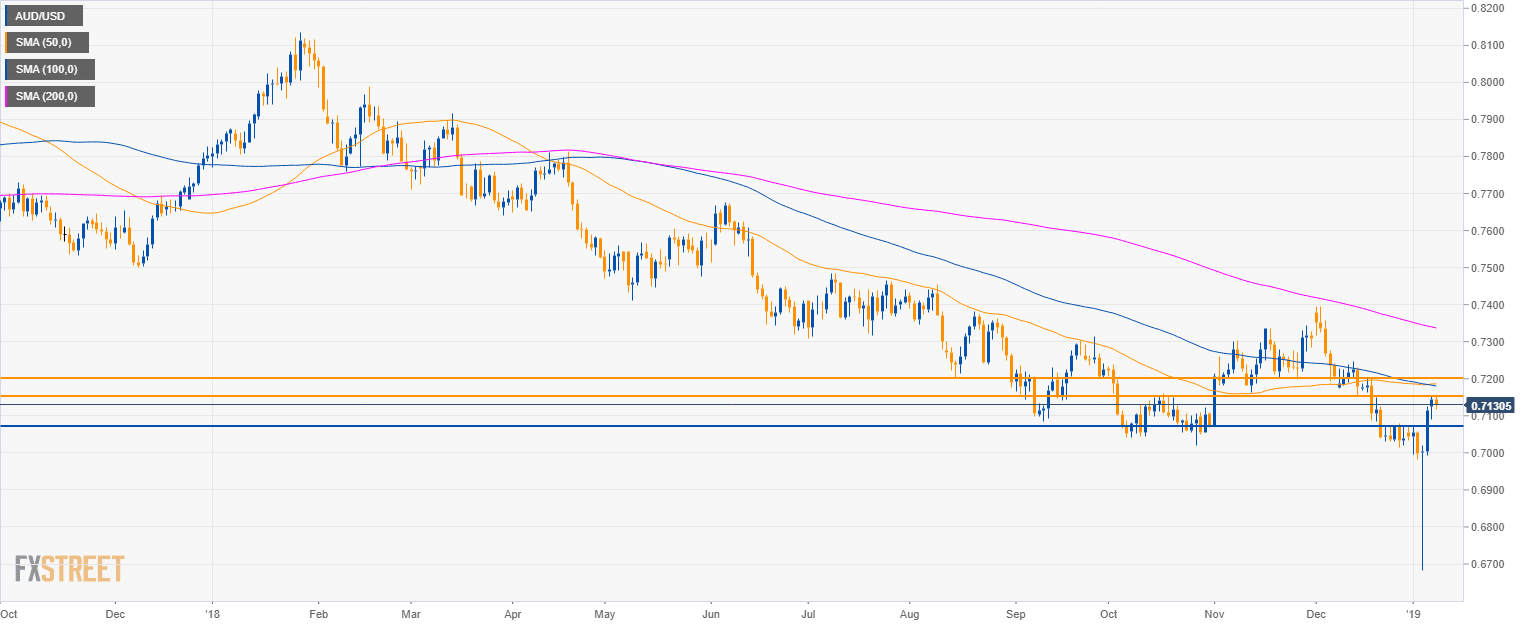
AUD/USD daily chart
- AUD/USD is trading in a bear trend below the 200-period simple moving average (SMA).
- The Aussie recovered more than 400 pips following the flash crash last week.
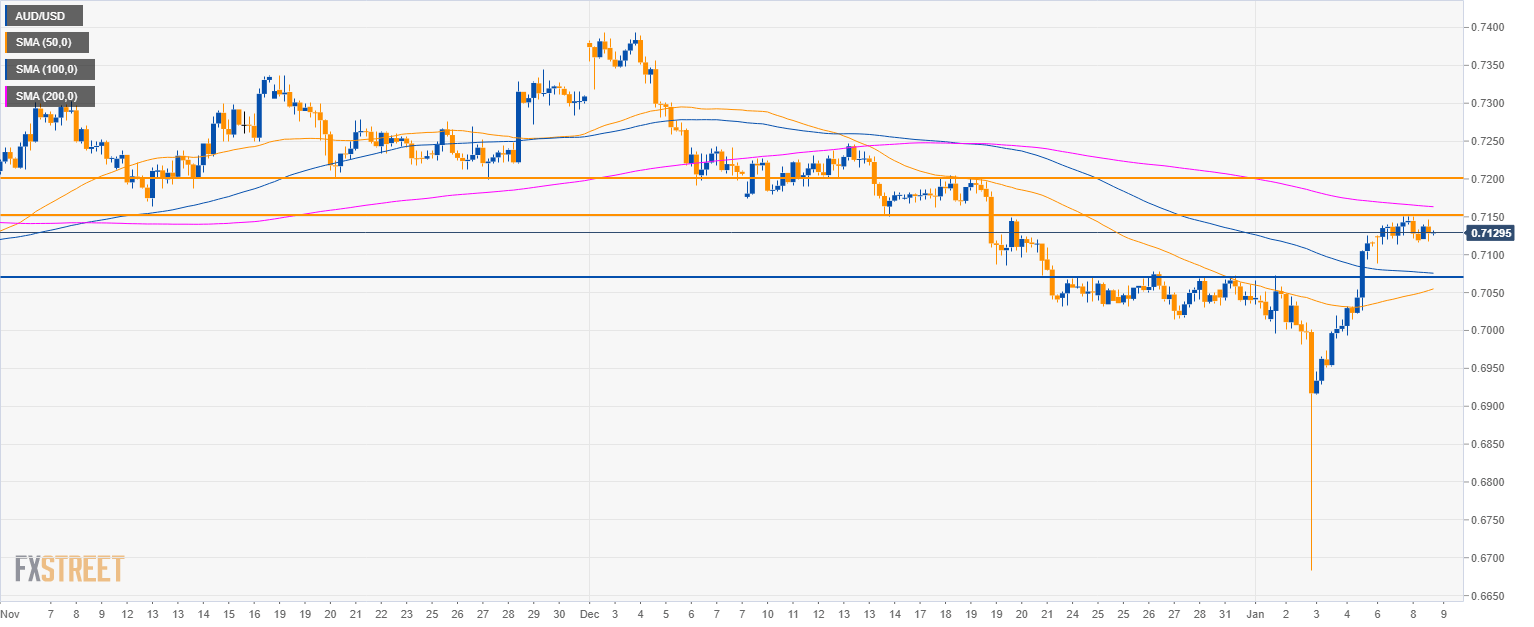
AUD/USD 4-hour chart
- AUD/USD bullish recovery is now stalling below the 0.7150 resistance and the 200 SMA.
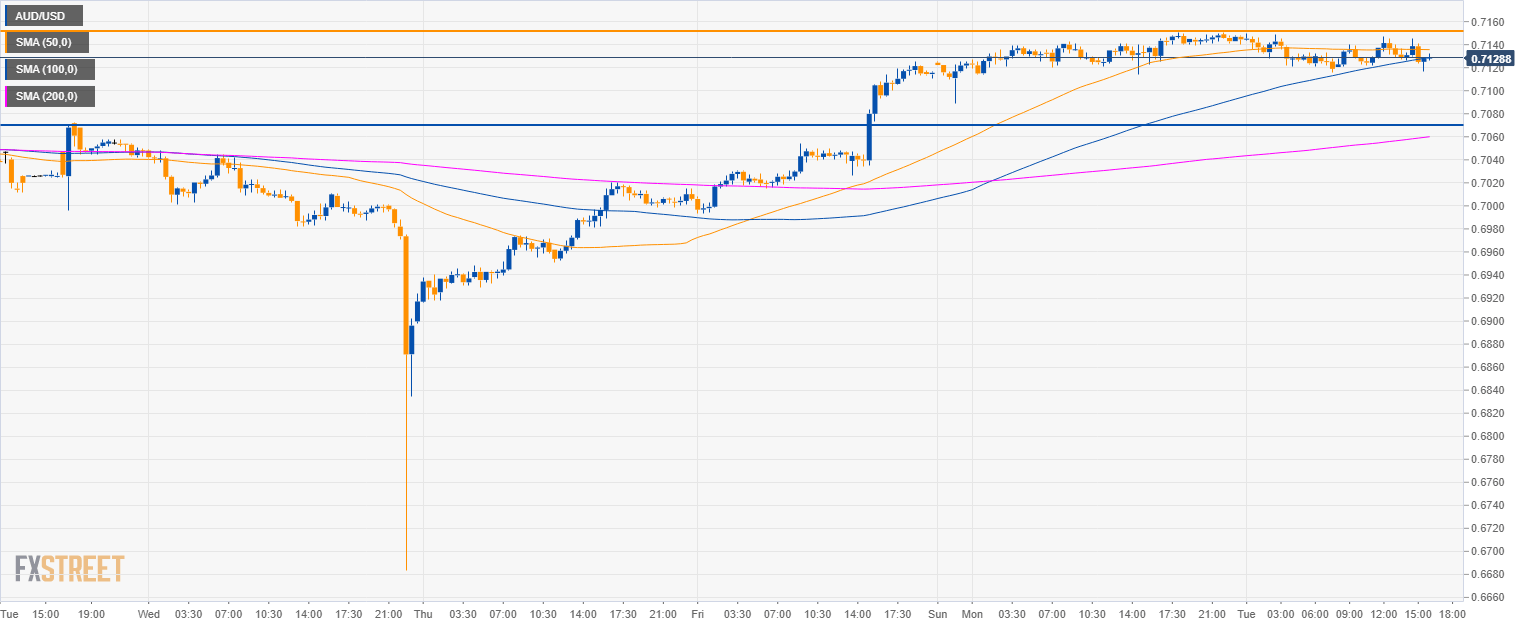
AUD/USD 30-minute chart
- As long as 0.7150 caps prices, bears might come back and drive the market back to 0.7070 target.
Additional key levels
AUD/USD
Overview:
Today Last Price: 0.713
Today Daily change: -14 pips
Today Daily change %: -0.196%
Today Daily Open: 0.7144
Trends:
Previous Daily SMA20: 0.7102
Previous Daily SMA50: 0.7186
Previous Daily SMA100: 0.7183
Previous Daily SMA200: 0.7341
Levels:
Previous Daily High: 0.7151
Previous Daily Low: 0.7089
Previous Weekly High: 0.7125
Previous Weekly Low: 0.6684
Previous Monthly High: 0.7394
Previous Monthly Low: 0.7014
Previous Daily Fibonacci 38.2%: 0.7127
Previous Daily Fibonacci 61.8%: 0.7113
Previous Daily Pivot Point S1: 0.7105
Previous Daily Pivot Point S2: 0.7066
Previous Daily Pivot Point S3: 0.7043
Previous Daily Pivot Point R1: 0.7167
Previous Daily Pivot Point R2: 0.719
Previous Daily Pivot Point R3: 0.7229
