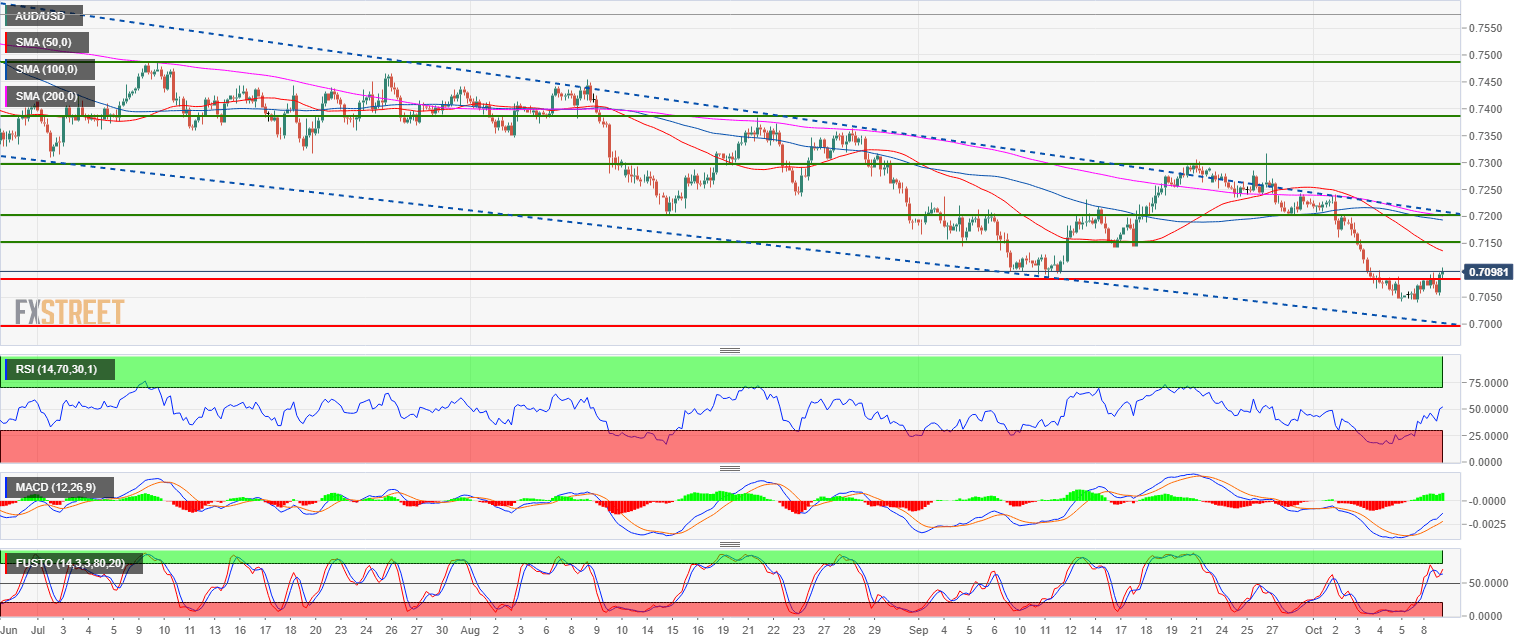
- AUD/USD is trading in a bear trend as it is evolving below its 50, 100 and 200-period simple moving average on the 4-hour chart.
- AUD/USD found support near 0.7050 as the bulls created a lower low with the September low. The RSI and the Stochastic indicators are trading above the 50 line while the MACD is turning bullish. While the main trend is bearish there is room for a bullish leg to the upside.
- Upside targets can be located near 0.7144 (September 5 low) and 0.7200 figure. A daily close below 0.7041 (October low) would likely invalidate the current bullish bias.
AUD/USD 4-hour chart
Spot rate: 0.7097
Relative change: 0.29%
High: 0.7103
Low: 0.7054
Main trend: Bearish
Short-term trend: Bullish
Resistance 1: 0.7085, September 11 low
Resistance 2: 0.7144 September 5 low
Resistance 3: 0.7200 figure August 15 low
Support 1: 0.7041 October low
Support 1: 0.7000 figure
Support 2: 0.6830 January 15, 2016 low
