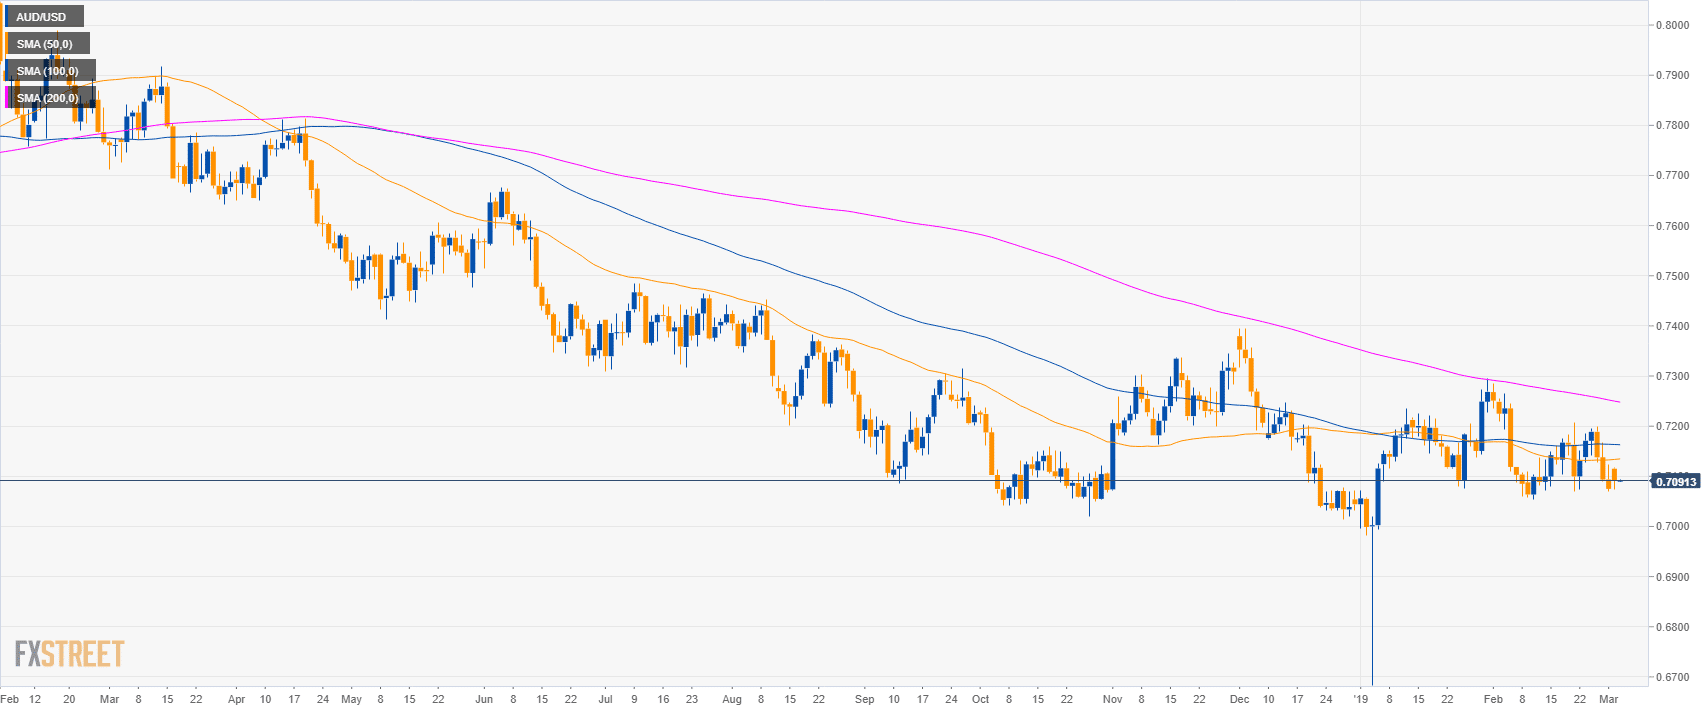
AUD/USD daily chart
- AUD/USD is trading in a bear trend below its main simple moving averages (SMAs).
- The Reserve Bank of Australia (RBA) will announce its interest rate decision and statement at 3.30 GMT, which can lead to high volatility in AUD-related currency pairs.
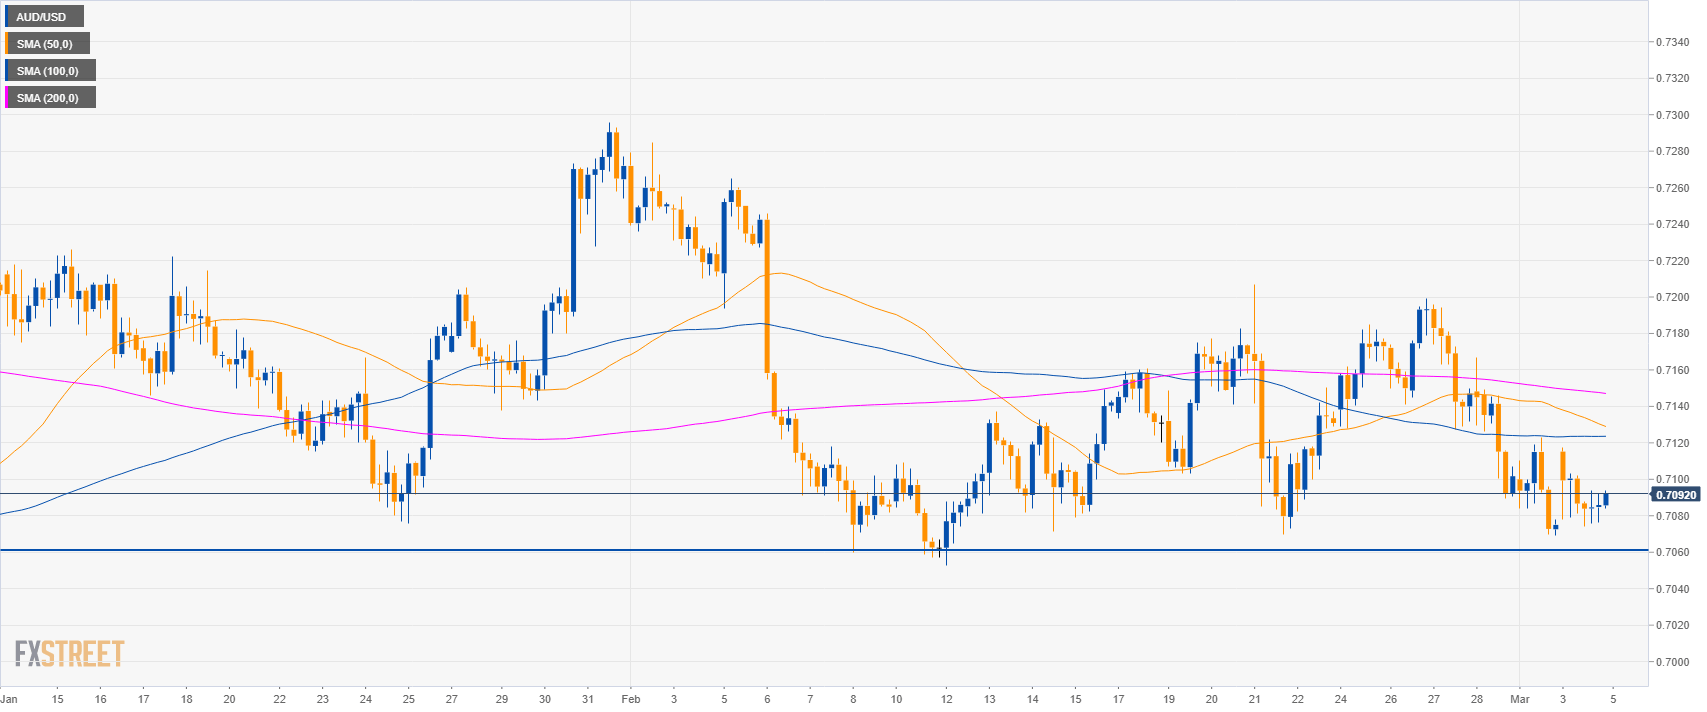
AUD/USD 4-hour chart
- AUD/USD is trading near 0.7060 support.
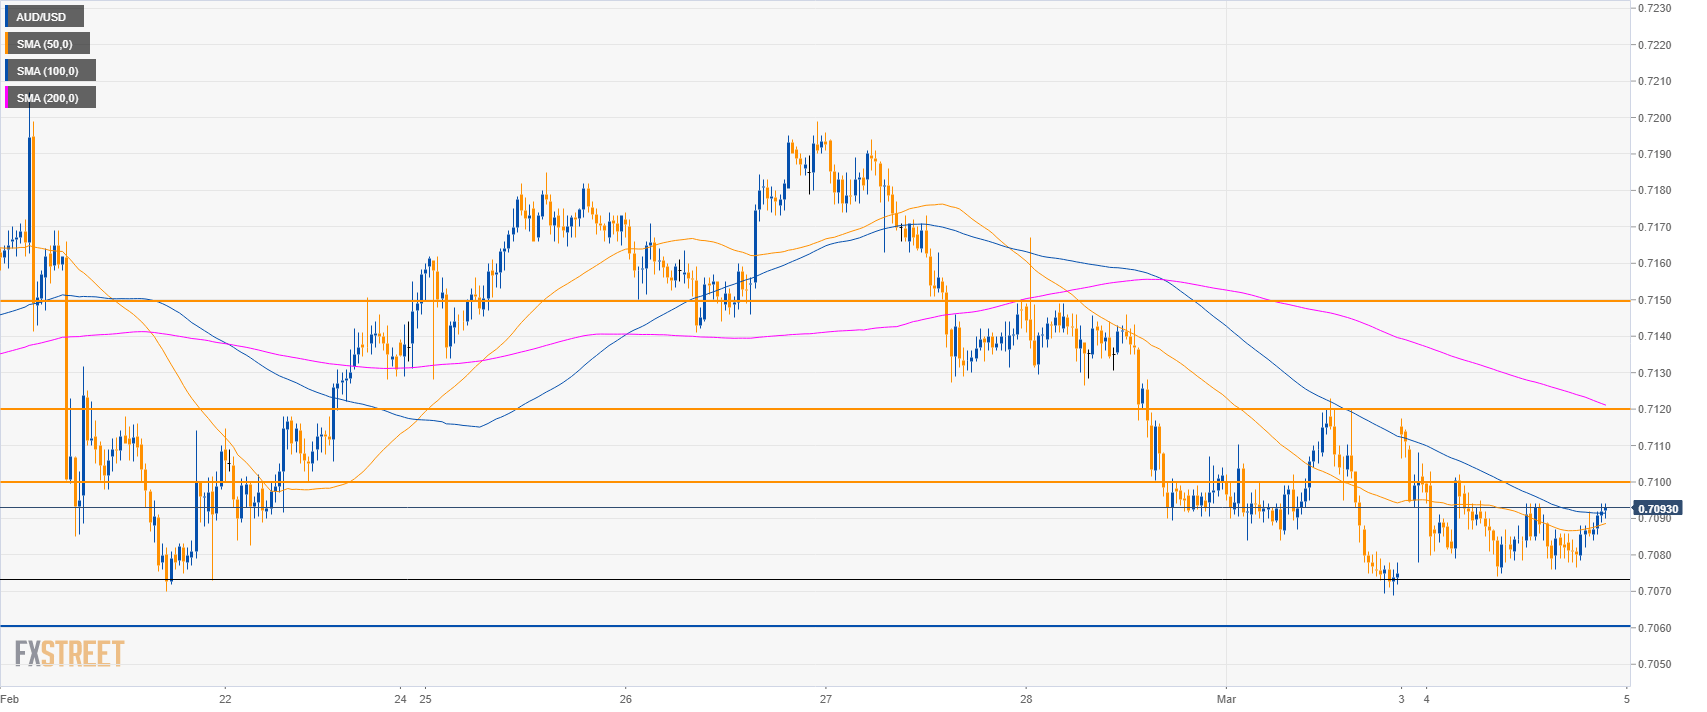
AUD/USD 30-minute chart
- AUD/USD is trying to break above the 0.7100 figure and the 50 and 100 SMA suggesting potential bullish momentum.
- Resistances are at 0.7120 and 0.7150 level.
- To the downside, support is at 0.7060 level.
Additional key levels
AUD/USD
Overview:
Today Last Price: 0.7092
Today Daily change: 17 pips
Today Daily change %: 0.24%
Today Daily Open: 0.7075
Trends:
Daily SMA20: 0.7131
Daily SMA50: 0.7133
Daily SMA100: 0.7164
Daily SMA200: 0.7252
Levels:
Previous Daily High: 0.7123
Previous Daily Low: 0.7069
Previous Weekly High: 0.7199
Previous Weekly Low: 0.7069
Previous Monthly High: 0.7285
Previous Monthly Low: 0.7053
Daily Fibonacci 38.2%: 0.709
Daily Fibonacci 61.8%: 0.7102
Daily Pivot Point S1: 0.7055
Daily Pivot Point S2: 0.7035
Daily Pivot Point S3: 0.7001
Daily Pivot Point R1: 0.7109
Daily Pivot Point R2: 0.7143
Daily Pivot Point R3: 0.7163
