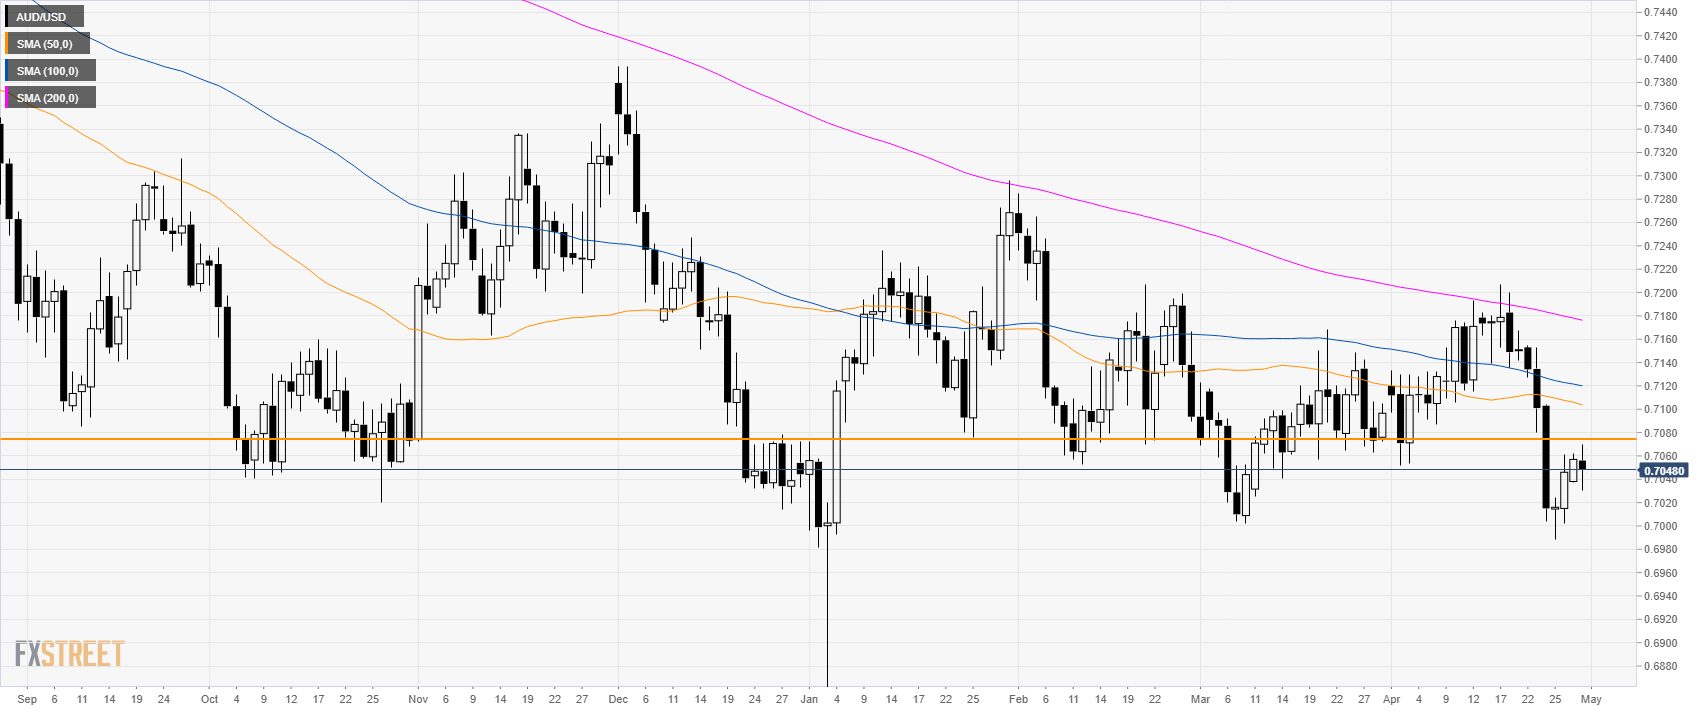
AUD/USD daily chart
- AUD/USD is trading in a bear trend below its mains simple moving averages (SMAs).
- AUD/USD is seen as bearish below 0.7075 resistance.
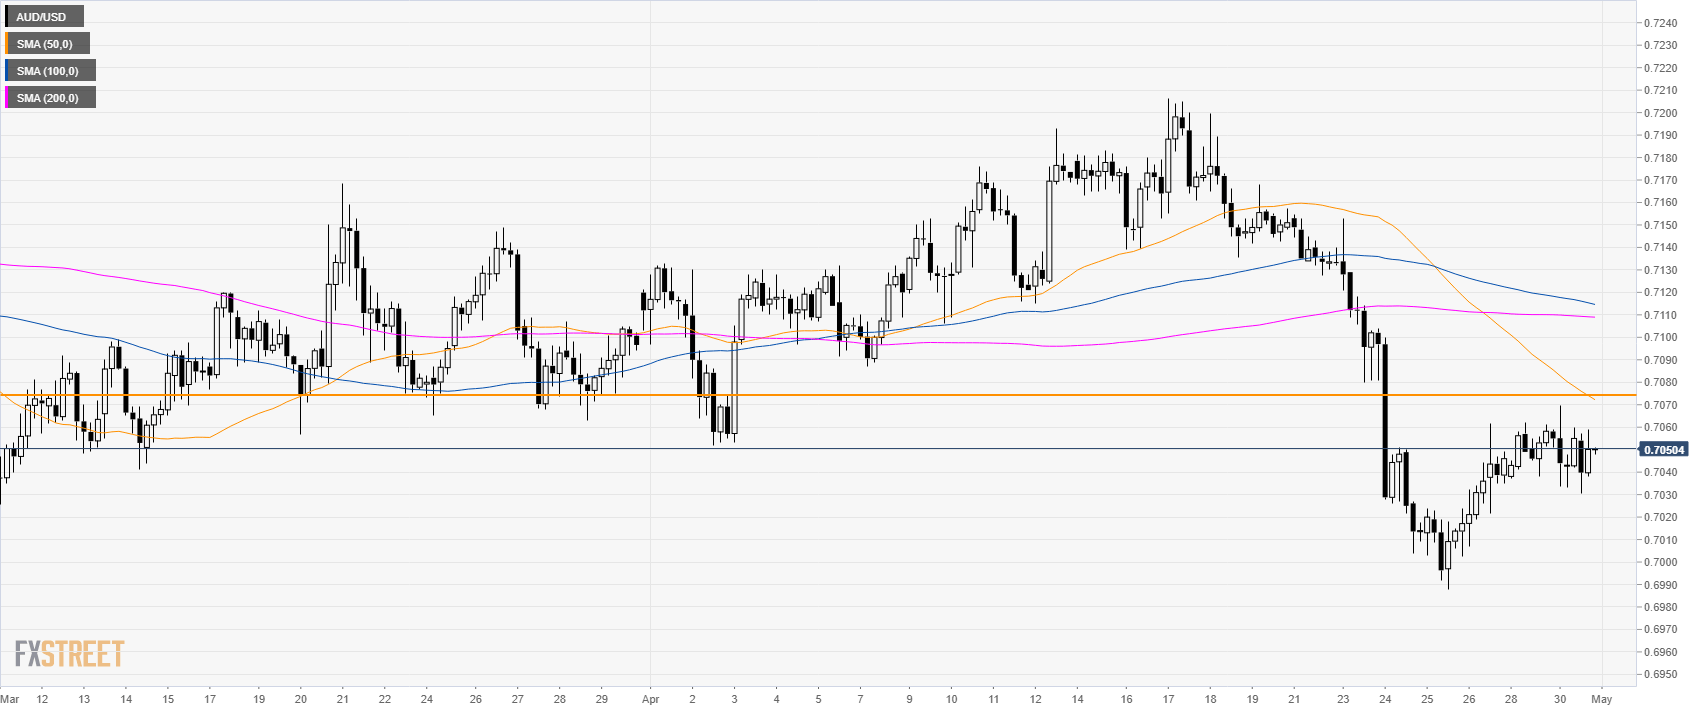
AUD/USD 4-hour chart
- AUD/USD is trading below its main SMAs suggesting a bearish bias in the medium-term.
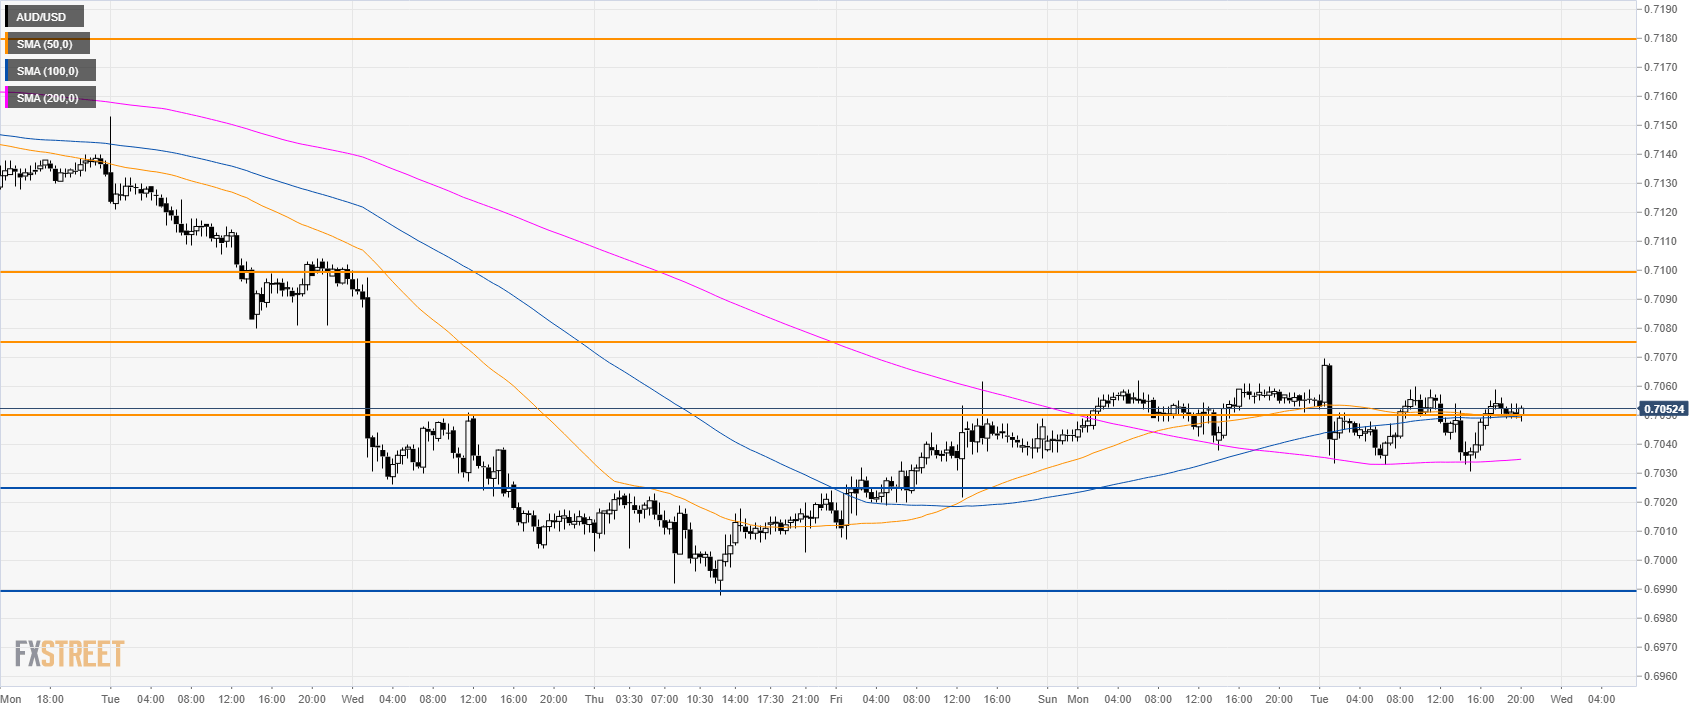
AUD/USD 30-minute chart
- AUD/USD has been trading sideways since the start of the week as the market is trading just above the flat 50 and 100 SMAs and above the 200 SMA.
- If bears can break 0.7025 to the downside, the market can extend down to 0.6990 support.
- However, in case bulls break 0.7075 and 0.7100 figure then the Aussie can see a run towards 0.7180 resistance.
Additional key levels
