- The US Durable Goods Orders came in worse-than-expected at -2.5% in April vs. -2% expected by anaysts. The news adds weight to the greenback weakness.
- AUD/USD is showing some strength in the last two days but can bulls sustain the counter-trend move at least to the 0.6960 resistance?
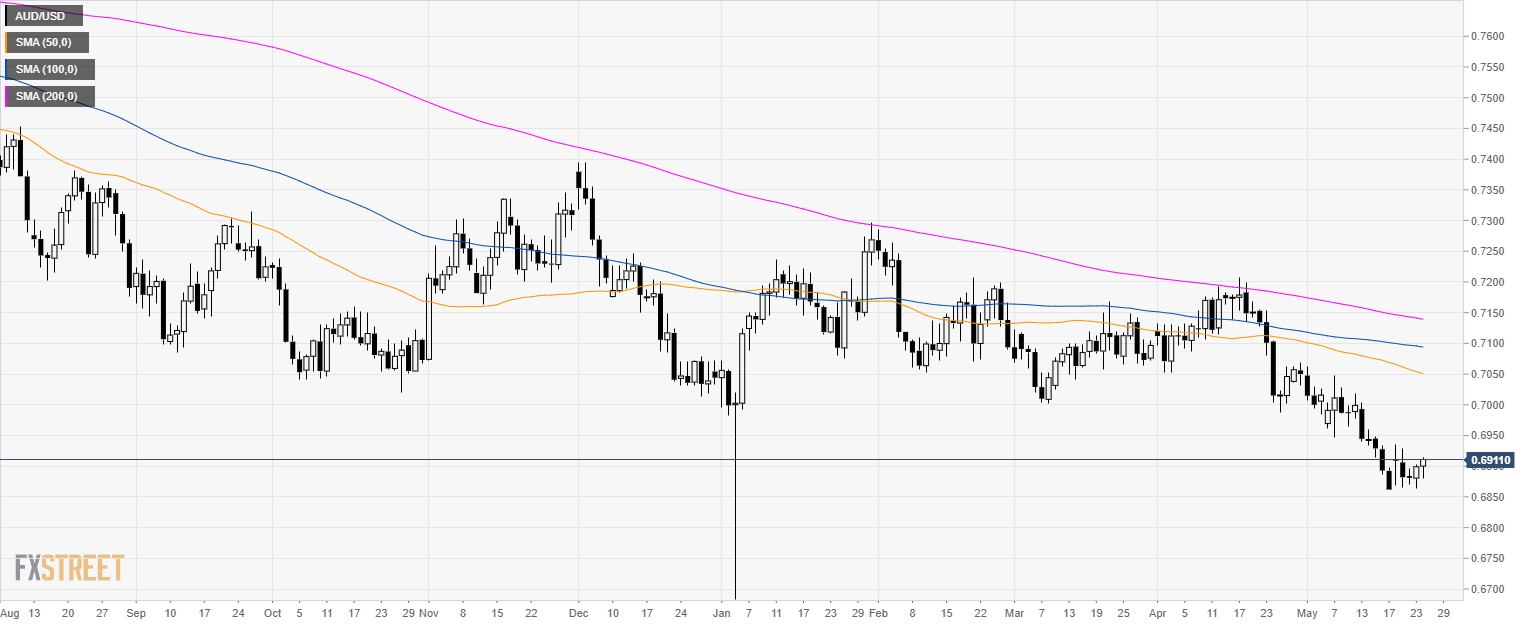
AUD/USD daily chart
AUD/USD is trading in a bear trend below its main simple moving averages (SMAs). The Aussie is consolidating its losses at multi-month lows.
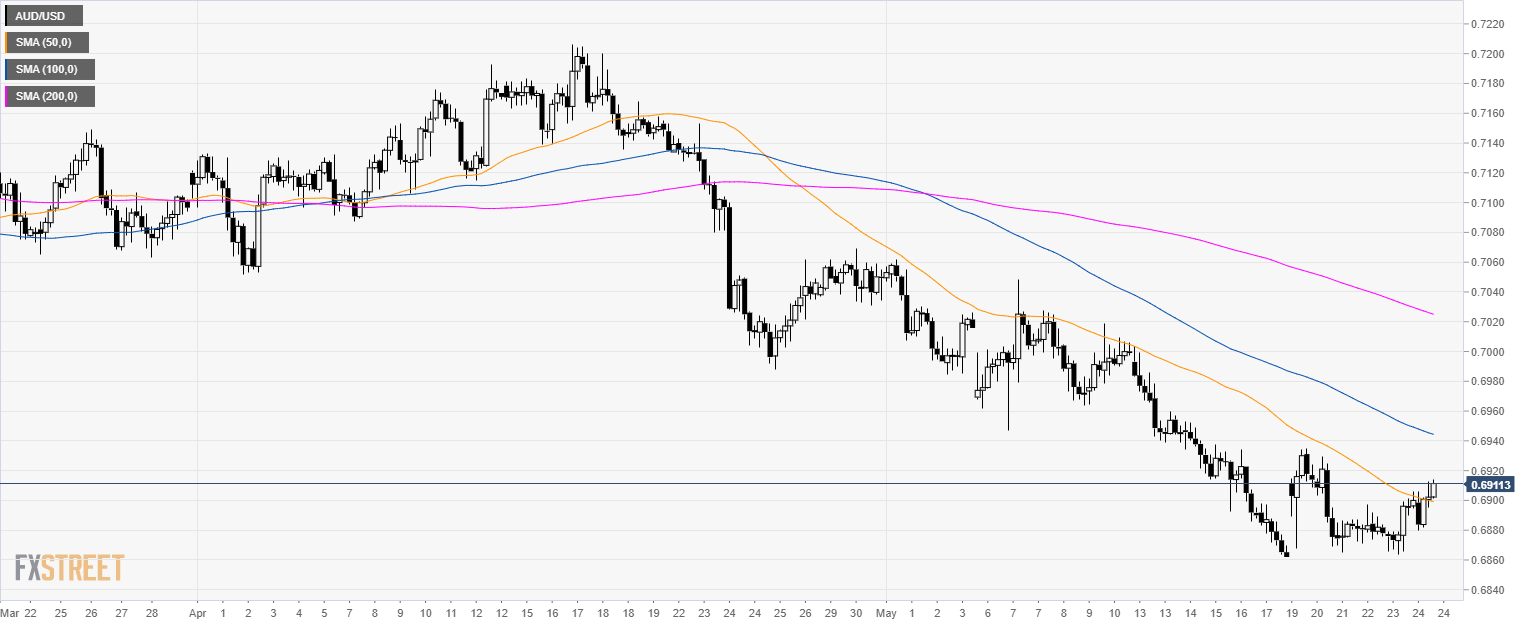
AUD/USD 4-hour chart
The current USD weakness is giving AUD/USD a boost while bulls are breaking above 0.6900 and and the 50 SMA.
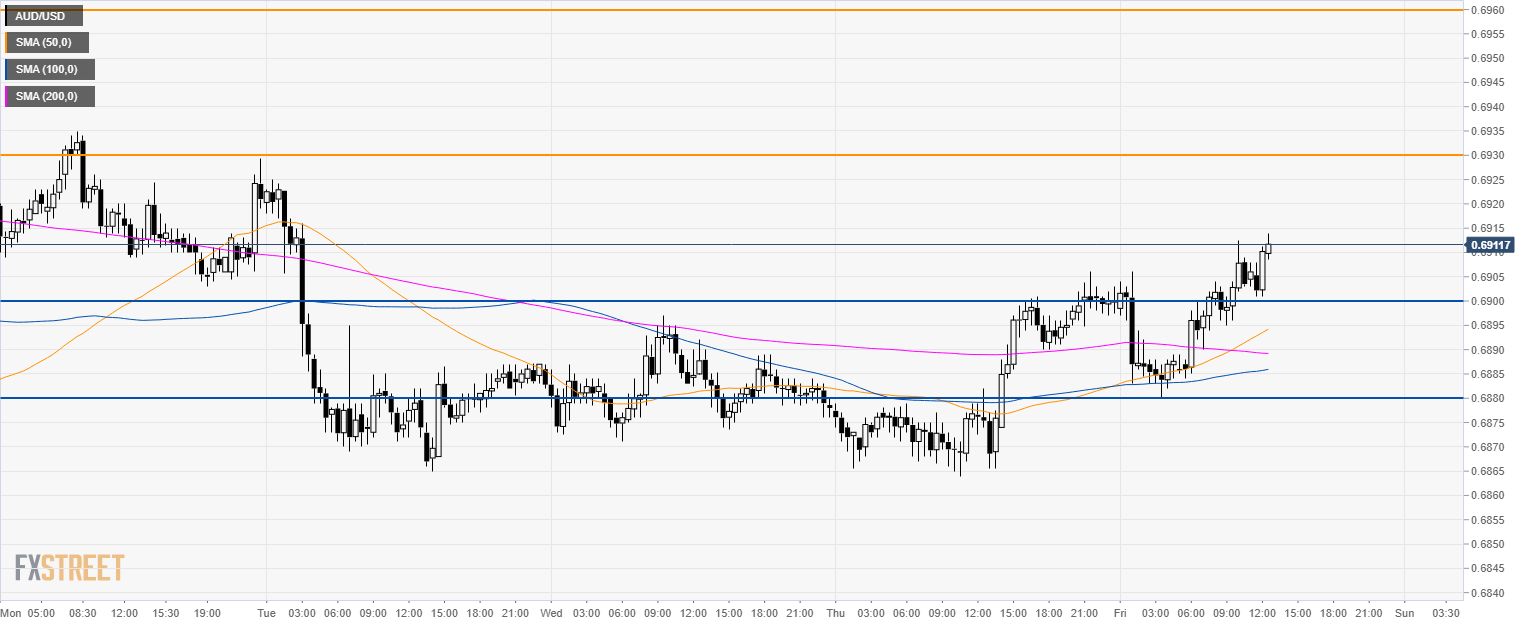
AUD/USD 30-minute chart
The Aussie is trading above the 0.6900 level and its main SMAs. Bulls can try to reach 0.6930 and 0.6960 resistances. Support is at the 0.6900 figure 0.6880 level.
Additional key levels


