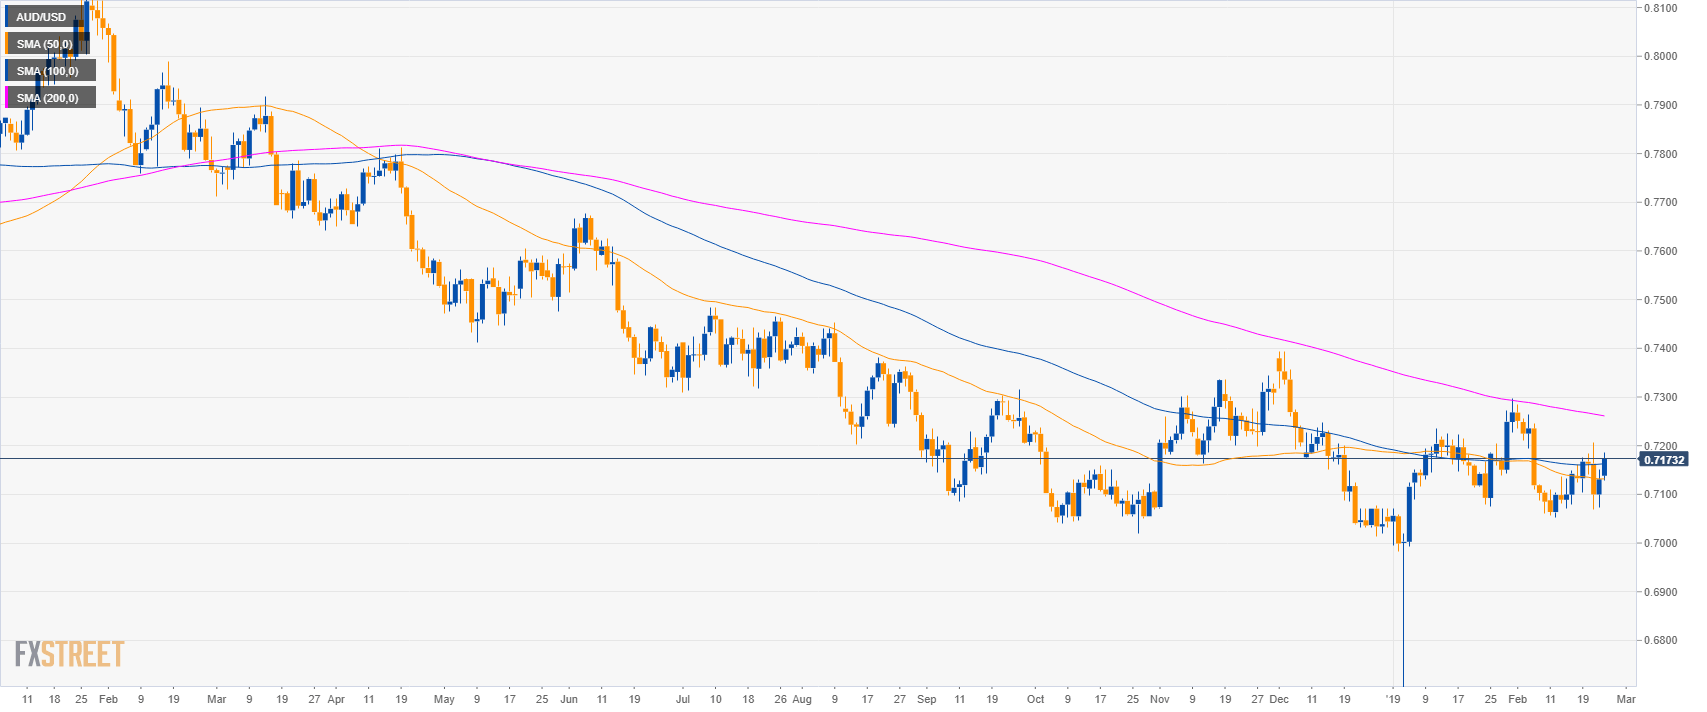
AUD/USD daily chart
- AUD/USD is trading in a bear trend below the 200-day simple moving average (SMA).
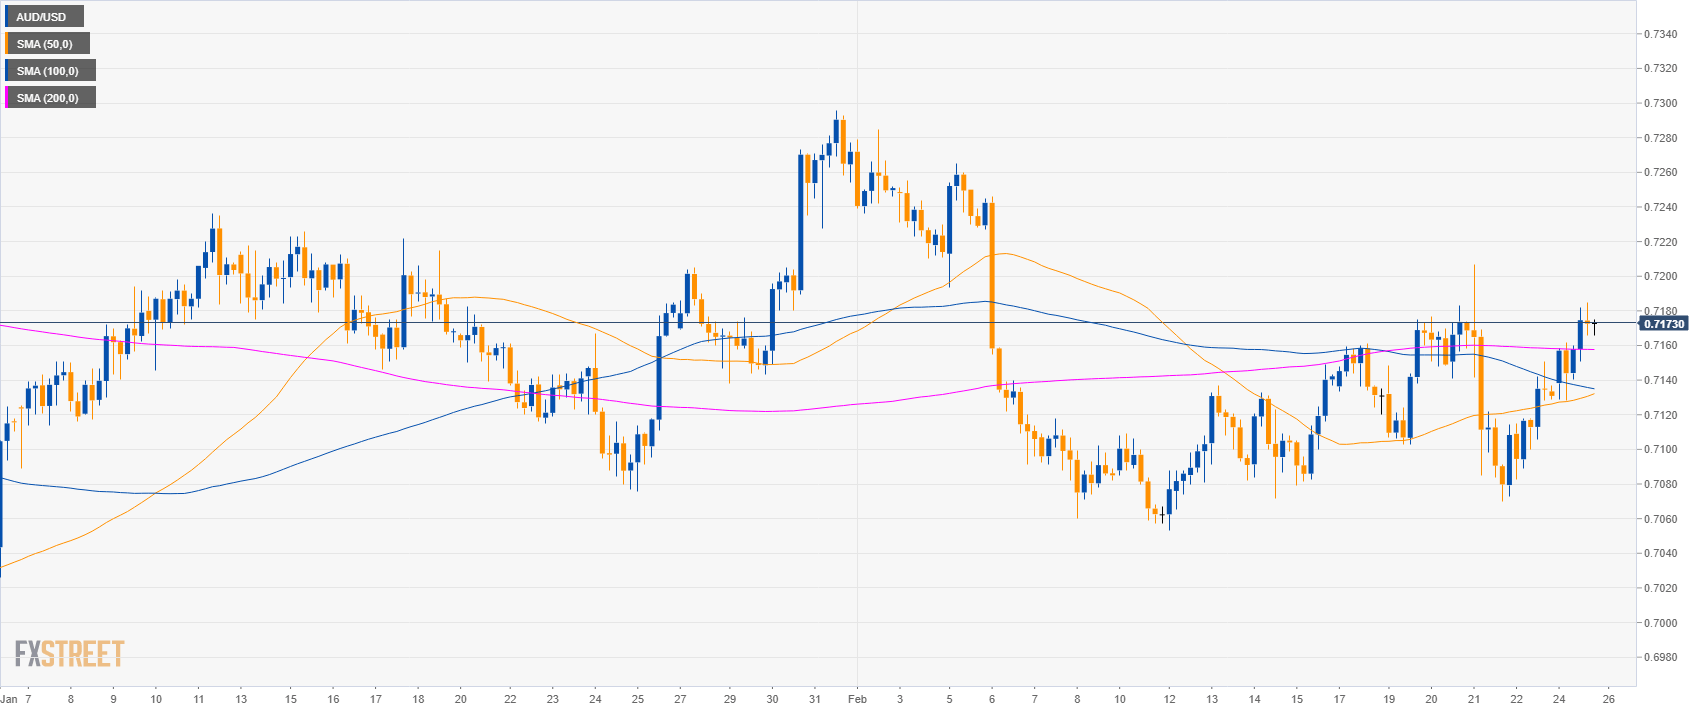
AUD/USD 4-hour chart
- AUD/USD is trading above its main SMAs suggesting bullish momentum in the medium-term.
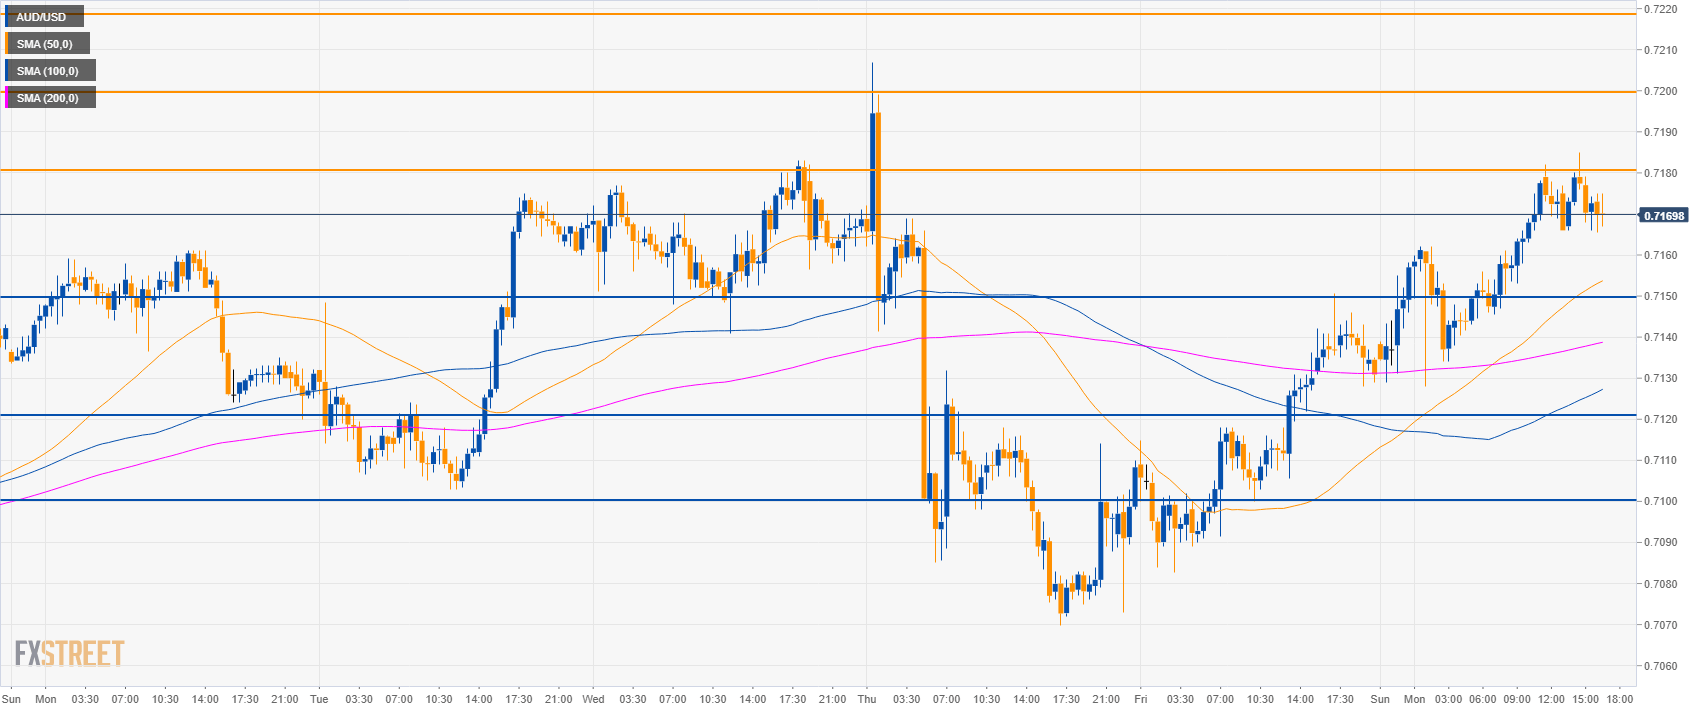
AUD/USD 30-minute chart
- AUD/USD is trading above its main SMAs suggesting bullish momentum in the short-term.
- Bulls need to overcome 0.7180 resistance to reach 0.7200 and 0.7220 to the upside.
- Support can be seen at 0.7150, 0.7120 and 0.7100 figure.
Additional key levels
AUD/USD
Overview:
Today Last Price: 0.7171
Today Daily change: 40 pips
Today Daily change %: 0.56%
Today Daily Open: 0.7131
Trends:
Daily SMA20: 0.7152
Daily SMA50: 0.7132
Daily SMA100: 0.7162
Daily SMA200: 0.7263
Levels:
Previous Daily High: 0.7151
Previous Daily Low: 0.7073
Previous Weekly High: 0.7207
Previous Weekly Low: 0.707
Previous Monthly High: 0.7296
Previous Monthly Low: 0.6684
Daily Fibonacci 38.2%: 0.7121
Daily Fibonacci 61.8%: 0.7103
Daily Pivot Point S1: 0.7086
Daily Pivot Point S2: 0.7041
Daily Pivot Point S3: 0.7008
Daily Pivot Point R1: 0.7163
Daily Pivot Point R2: 0.7196
Daily Pivot Point R3: 0.7241
