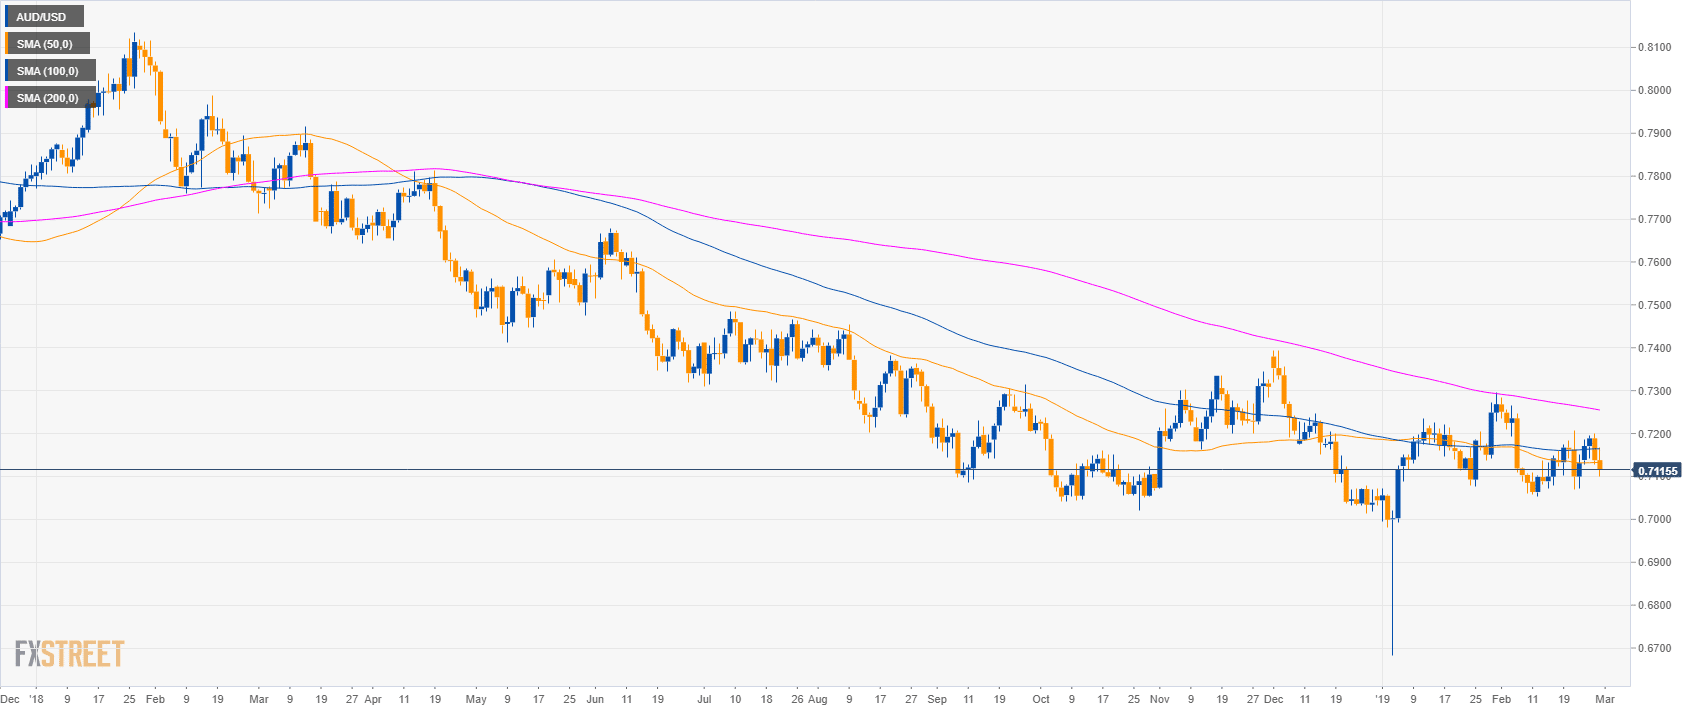
AUD/USD daily chart
- AUD/USD is trading below its main simple moving average suggesting bearish momentum.
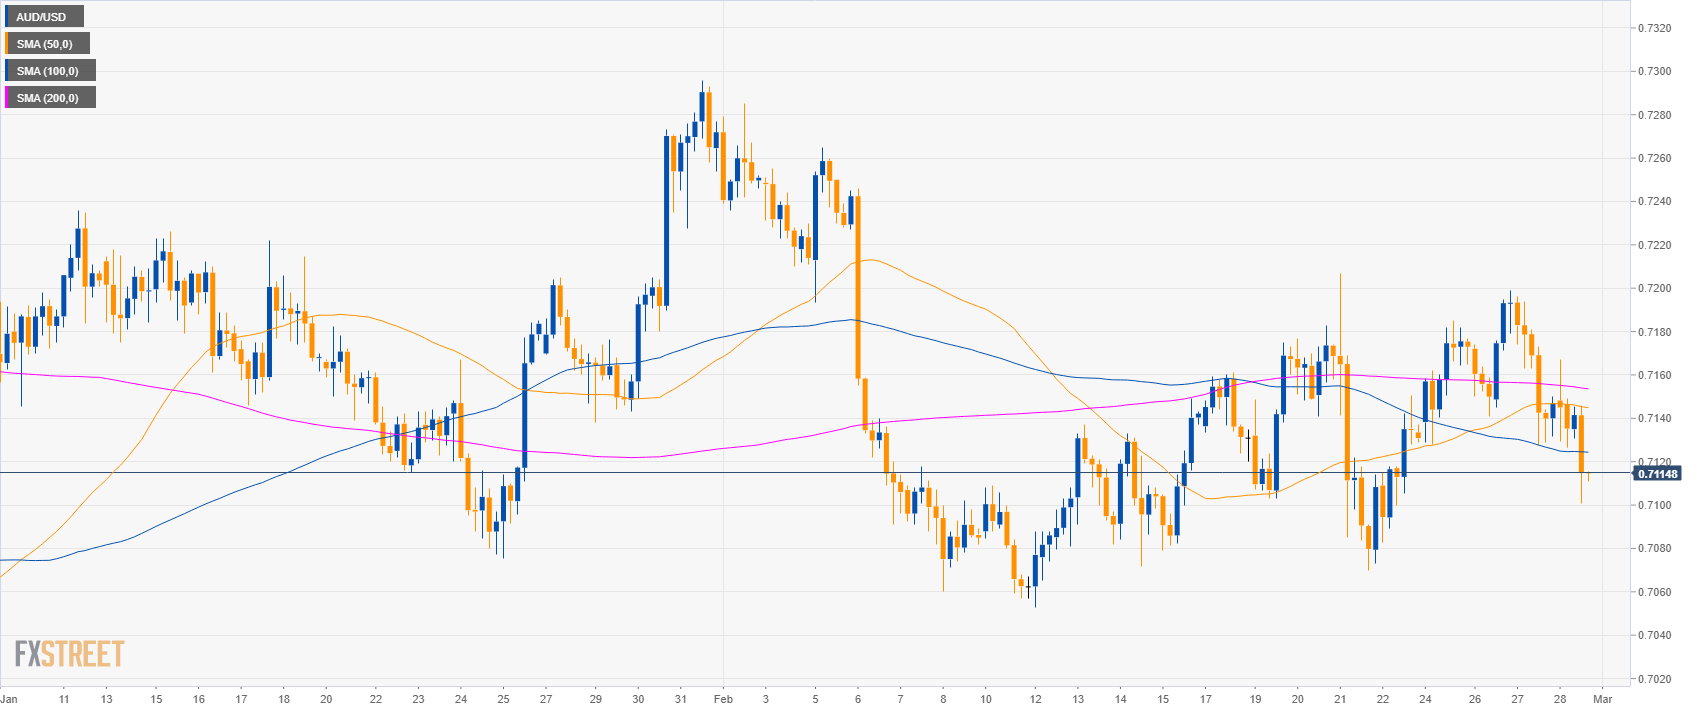
AUD/USD 4-hour chart
- AUD/USD is trading below its main SMAs suggesting bearish momentum in the medium-term.
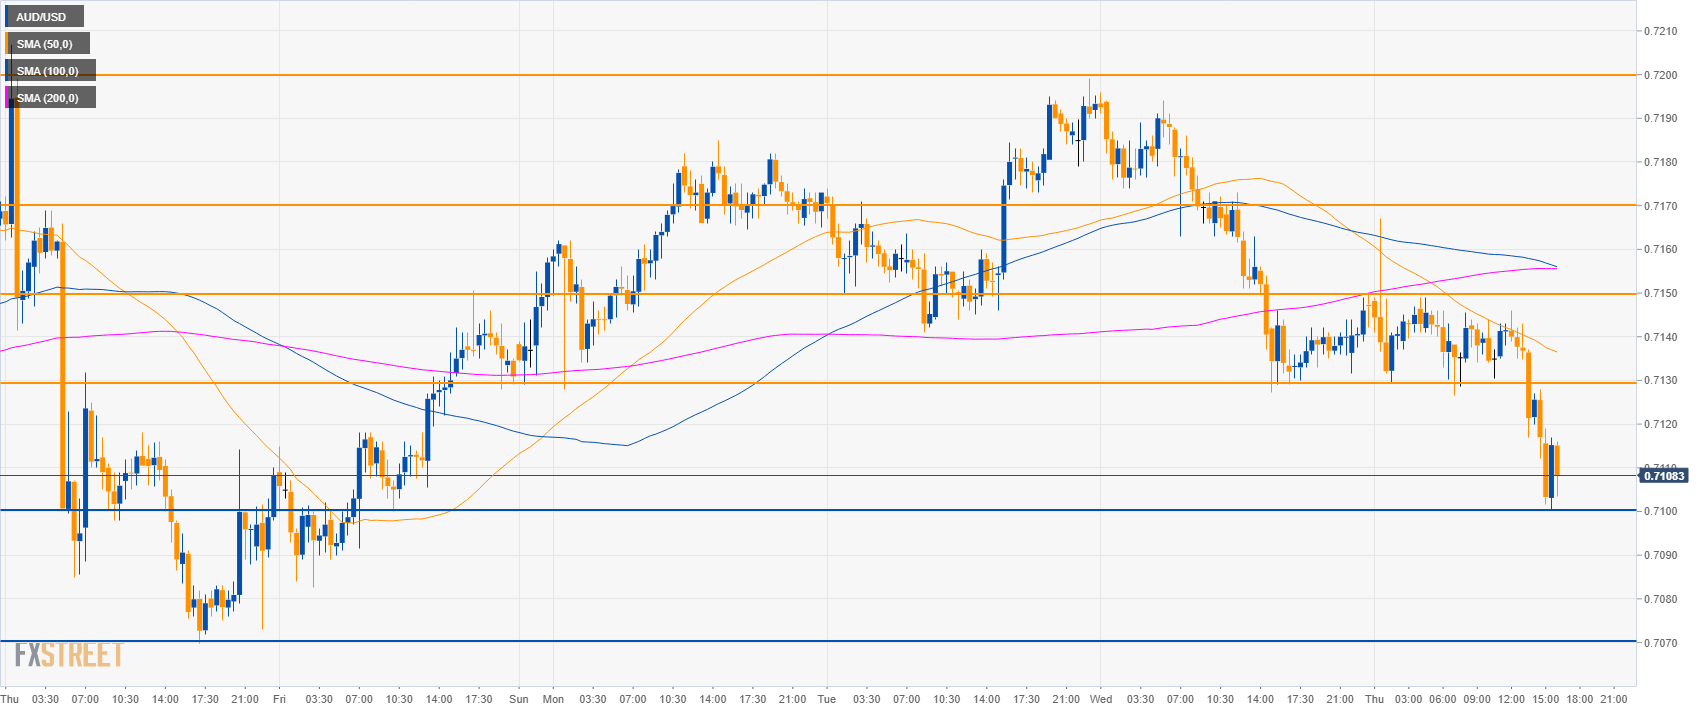
AUD/USD 30-minute chart
- AUD/USD is trading below the main SMAs suggesting bearish momentum in the short-term.
- A break below 0.7100 on a daily closing basis would open the gates to 0.7030 support.
- On the way up resistances are at 0.7130, 0.7150 and 0.7200 level.
Additional key levels
AUD/USD
Overview:
Today Last Price: 0.7115
Today Daily change: -23 pips
Today Daily change %: -0.32%
Today Daily Open: 0.7138
Trends:
Daily SMA20: 0.7149
Daily SMA50: 0.7133
Daily SMA100: 0.7165
Daily SMA200: 0.7257
Levels:
Previous Daily High: 0.7199
Previous Daily Low: 0.7127
Previous Weekly High: 0.7207
Previous Weekly Low: 0.707
Previous Monthly High: 0.7296
Previous Monthly Low: 0.6684
Daily Fibonacci 38.2%: 0.7155
Daily Fibonacci 61.8%: 0.7172
Daily Pivot Point S1: 0.711
Daily Pivot Point S2: 0.7083
Daily Pivot Point S3: 0.7039
Daily Pivot Point R1: 0.7182
Daily Pivot Point R2: 0.7226
Daily Pivot Point R3: 0.7254
