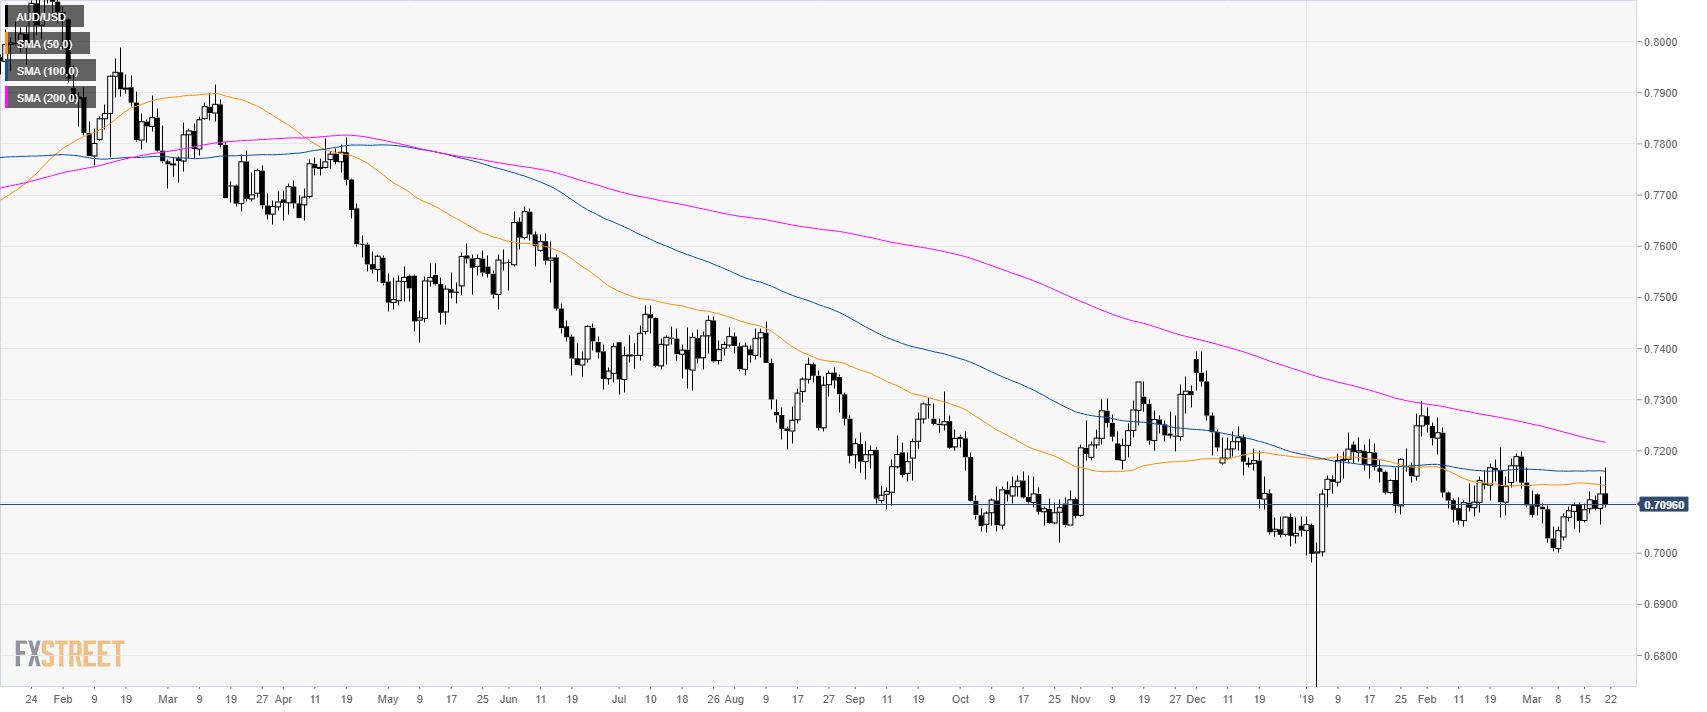
AUD/USD daily chart
- AUD/USD is trading in a bear trend below its main simple moving averages (SMAs).
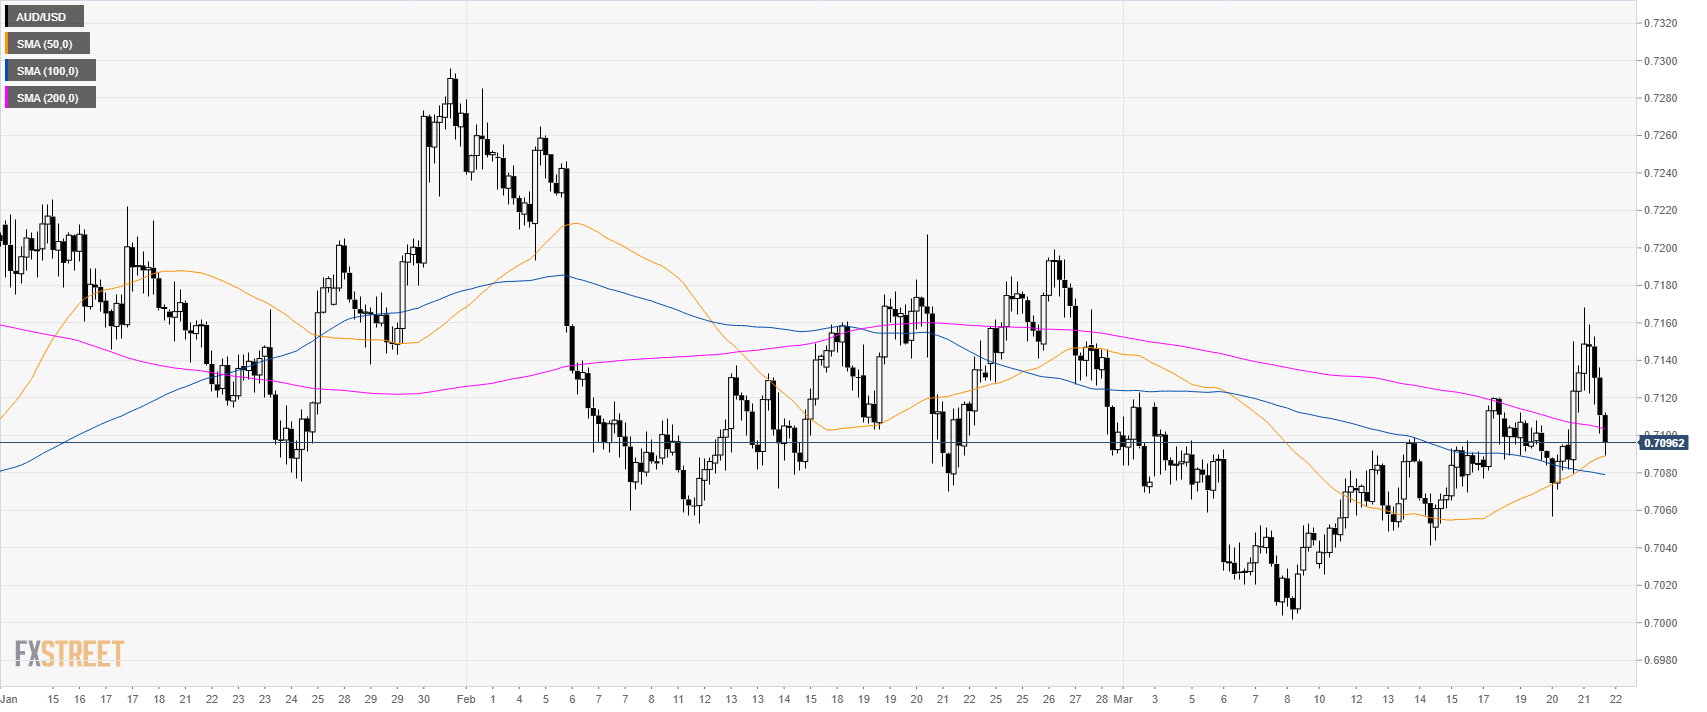
AUD/USD 4-hour chart
- AUD/USD is trading between the 50 and 200 SMAs suggesting a consolidation phase in the medium-term.
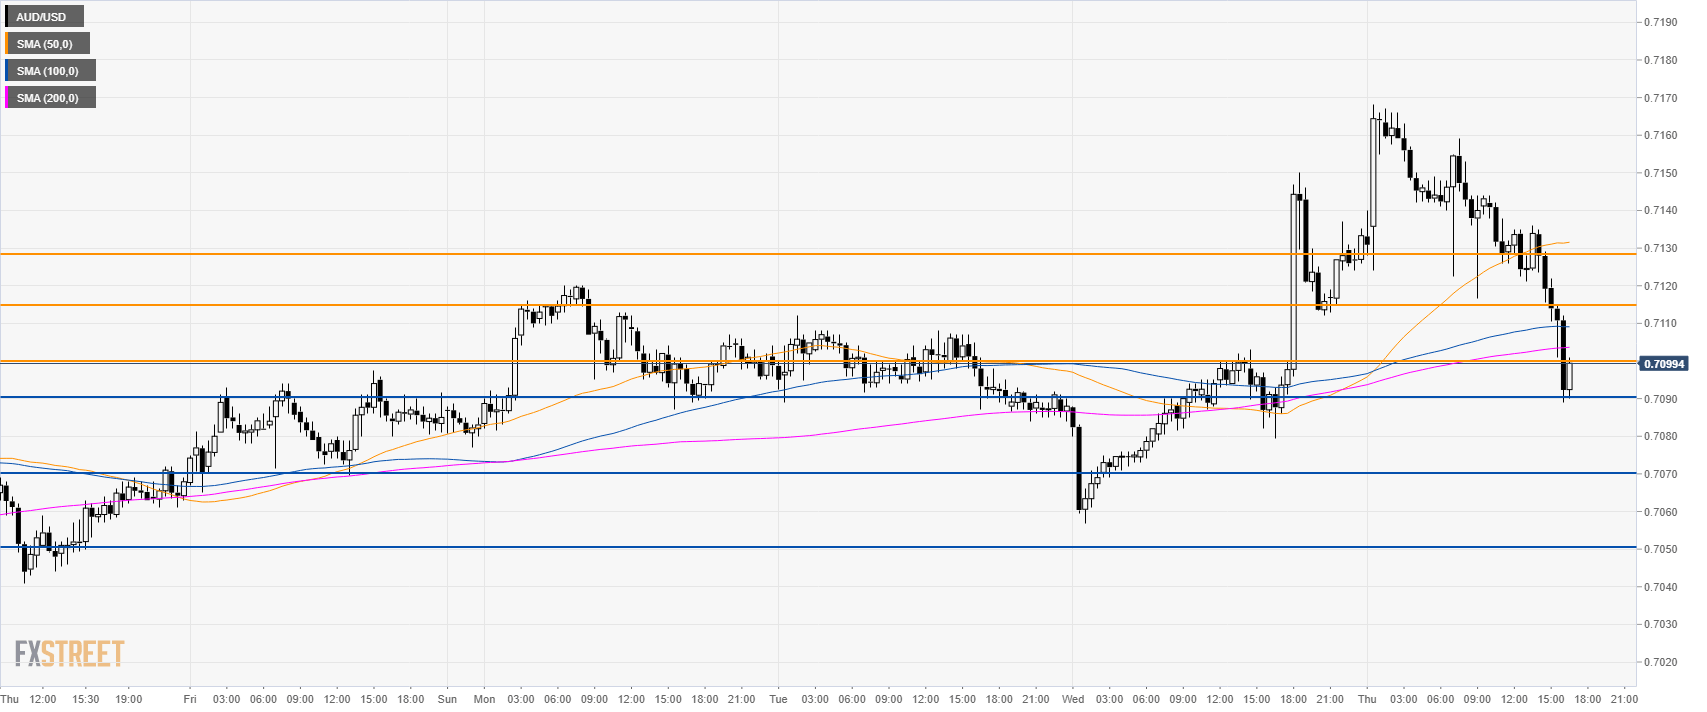
AUD/USD 30-minute chart
- AUD/USD is trading below its main SMAs suggesting bearish momentum in the short-term.
- A bear break below 0.7090 can lead to 0.7070 and 0.7050 level.
- Resistances are at 0.7100 figure and 0.7115 level.
Additional key levels
