- AUD/USD is trading in a bear trend.
- AUD/USD broke below 0.7144 September 5 low while the market is trading below its main simple moving averages. The RSI, MACD and Stochastics indicators are in bearish territories.
- A continuation of the bear move should lead to 0.7085 (current 2018 low). On the flip side, a break above 0.7200 would likely invalidate the current bearish bias.
AUD/USD 4-hour chart
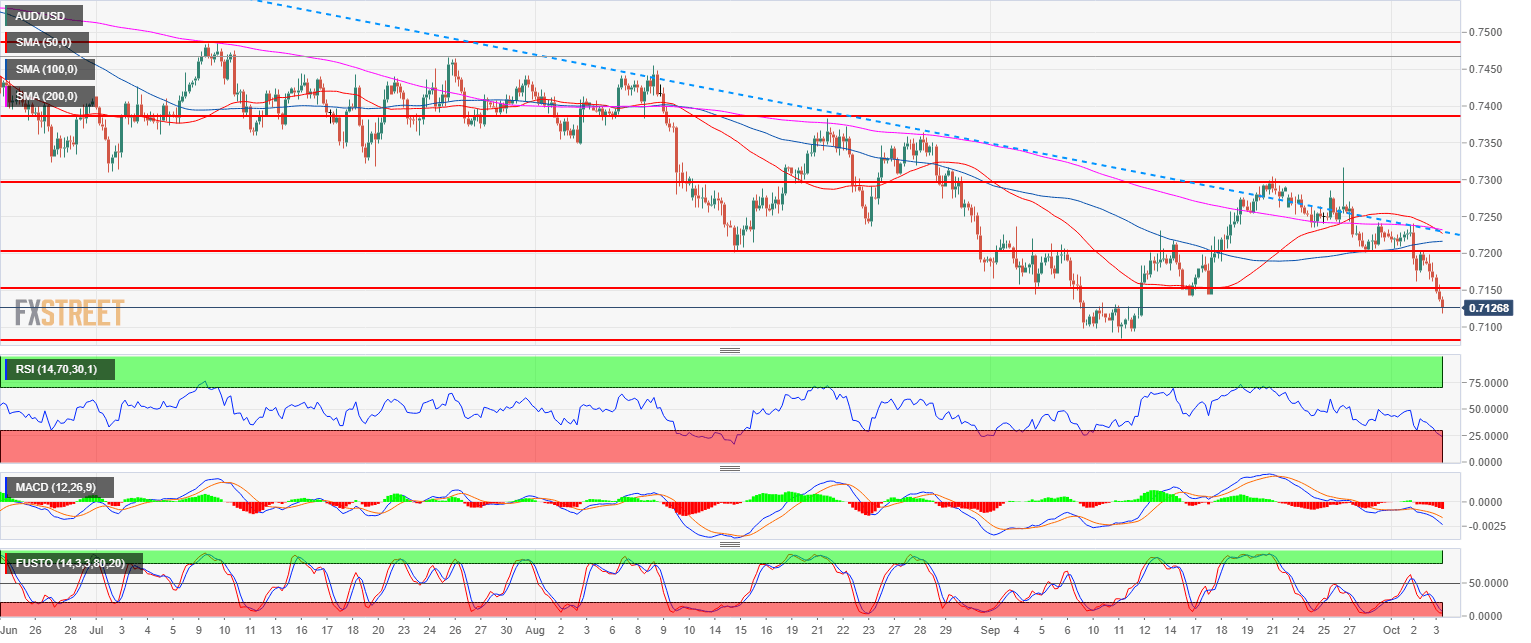
Spot rate: 0.7126
Relative change: -0.87%
High: 0.7198
Low: 0.7118
Main trend: Bearish
Resistance 1: 0.7144 September 5 low
Resistance 2: 0.7200 figure August 15 low
Resistance 3: 0.7236 August 24 low
Resistance 4: 0.7255 August 13 low
Resistance 5: 0.7294-0.7307 August 13 high, 50 DMA
Resistance 6: 0.7383 August 21 high
Resistance 7: 0.7485 July 10 high
Support 1: 0.7085, current 2018 low
Support 2: 0.7000 figure
Support 3: 0.6830 January 15, 2016 low
