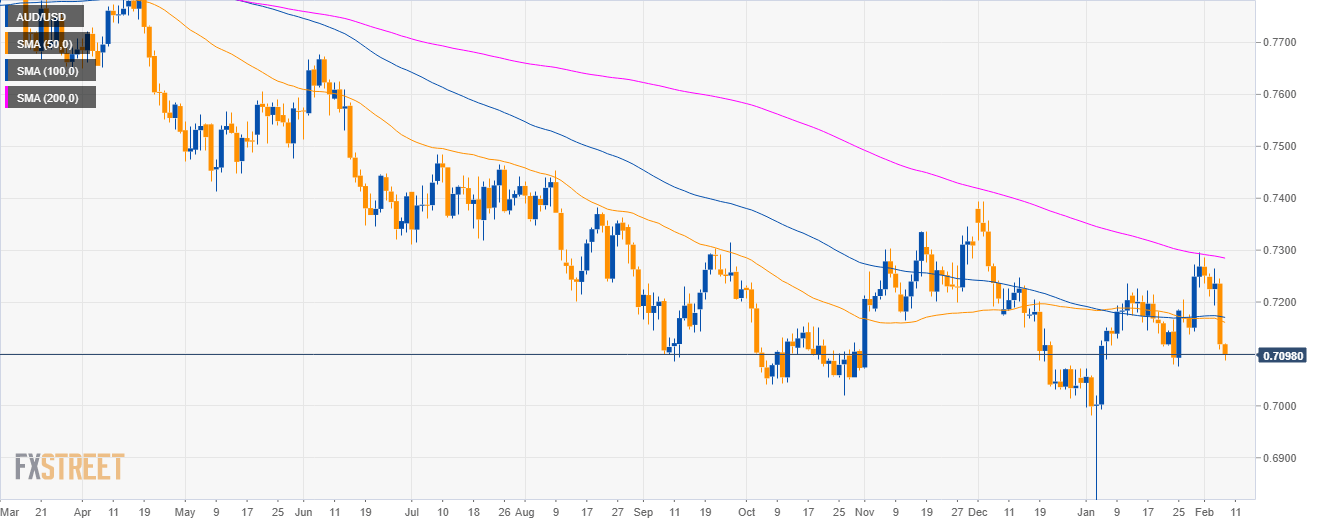
AUD/USD daily chart
- AUD/USD is trading in a bear trend below the 200-day simple moving average (SMA).
- Back on Wednesday, Reserve Bank of Australia’s Lowe shifted the forward guidance to neutral and hinted at cutting rates and the AUD dropped more than a 100 pips.
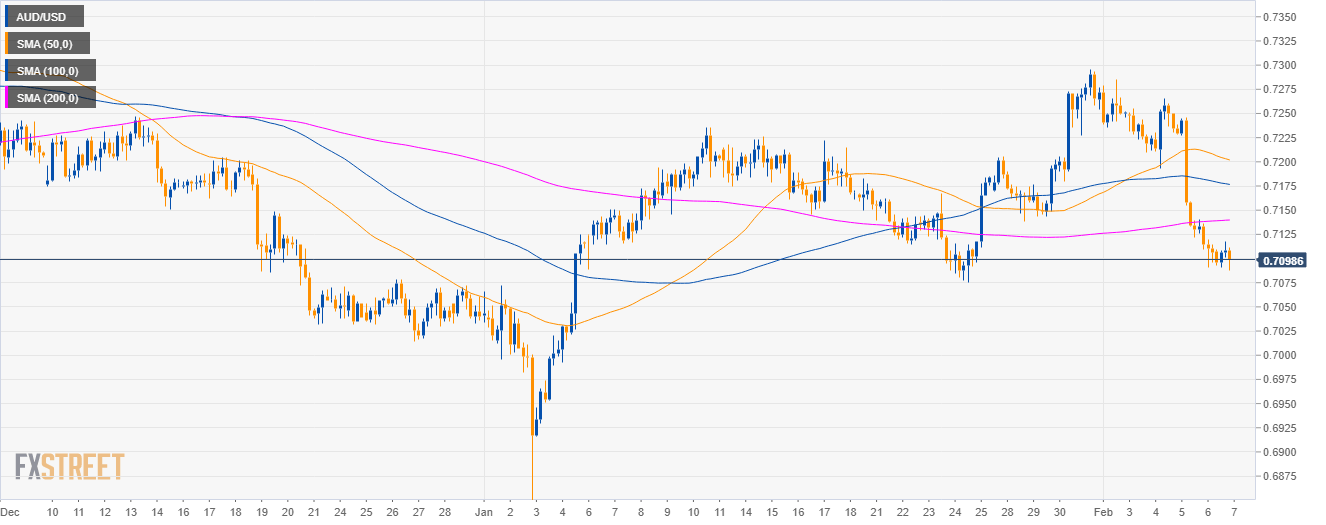
AUD/USD 4-hour chart
- AUD/USD is trading below its main SMAs suggesting bearish momentum in the medium-term.
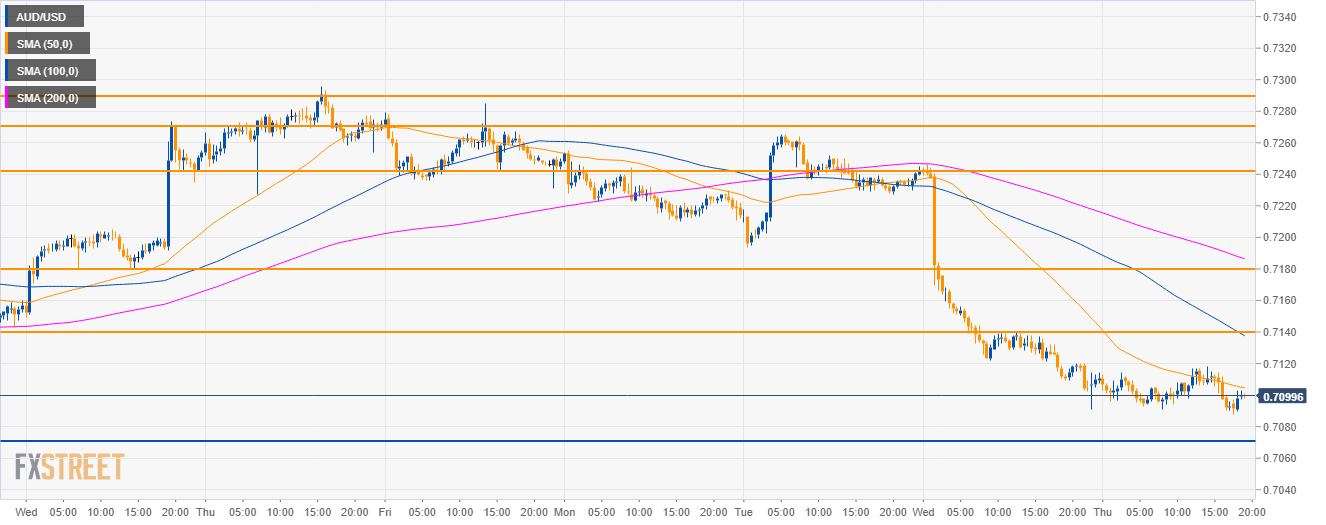
AUD/USD 30-minute chart
- Aussie is trading below its main SMAs suggesting bearish momentum in the short-term.
- Bears will need to overcome the 0.7070 support in order to travel to 0.7000 figure to the downside.
- On the flip side, resistances are seen near 0.7140 and 0.7180 level.
Additional key levels
AUD/USD
Overview:
Today Last Price: 0.71
Today Daily change: -19 pips
Today Daily change %: -0.27%
Today Daily Open: 0.7119
Trends:
Daily SMA20: 0.7184
Daily SMA50: 0.7165
Daily SMA100: 0.7172
Daily SMA200: 0.7287
Levels:
Previous Daily High: 0.7246
Previous Daily Low: 0.7109
Previous Weekly High: 0.7296
Previous Weekly Low: 0.7138
Previous Monthly High: 0.7296
Previous Monthly Low: 0.6684
Daily Fibonacci 38.2%: 0.7161
Daily Fibonacci 61.8%: 0.7194
Daily Pivot Point S1: 0.707
Daily Pivot Point S2: 0.7021
Daily Pivot Point S3: 0.6933
Daily Pivot Point R1: 0.7207
Daily Pivot Point R2: 0.7295
Daily Pivot Point R3: 0.7344
