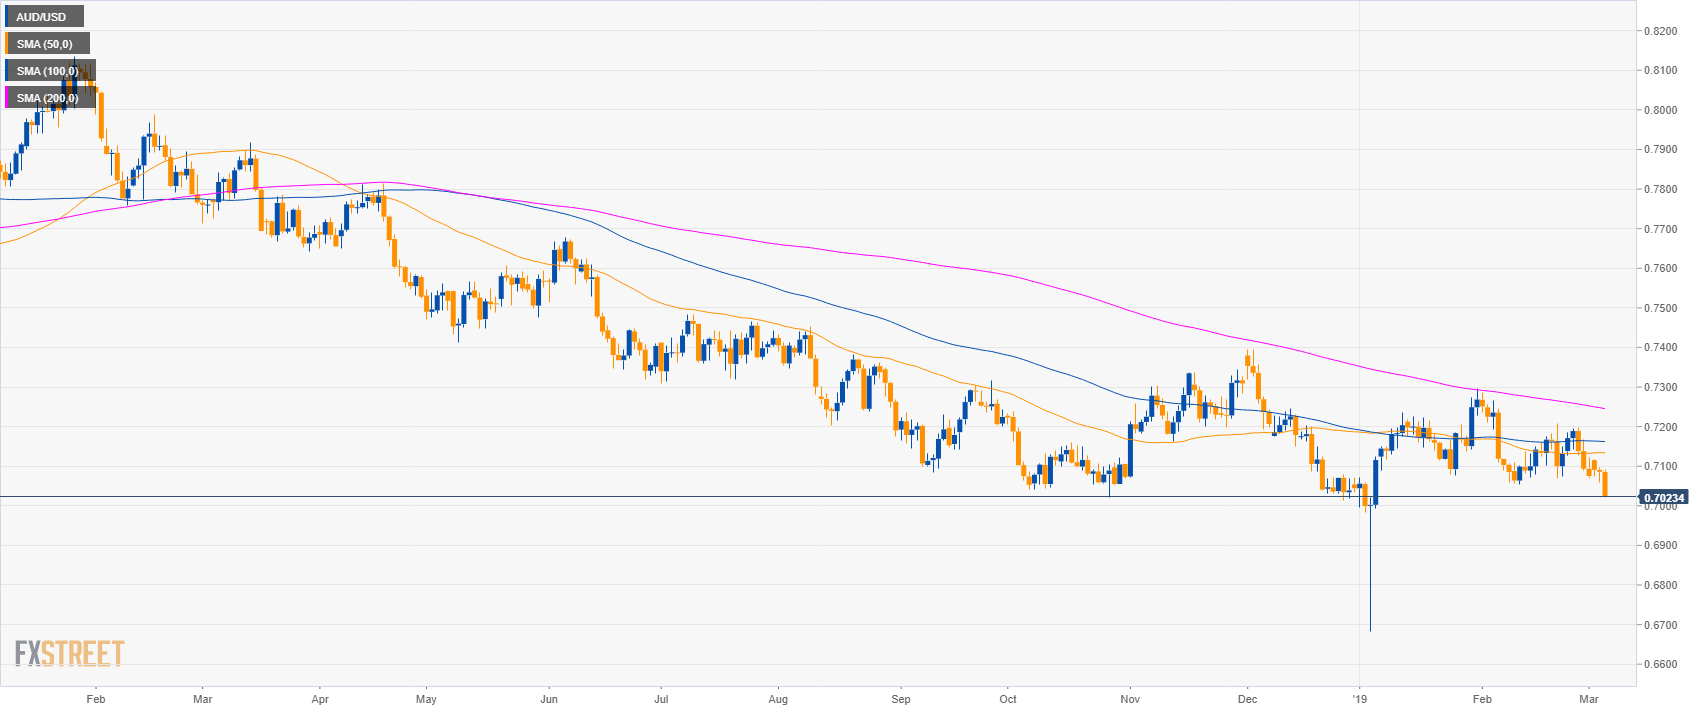
AUD/USD daily chart
- AUD/USD is trading in a bear trend below its main simple moving averages (SMAs).
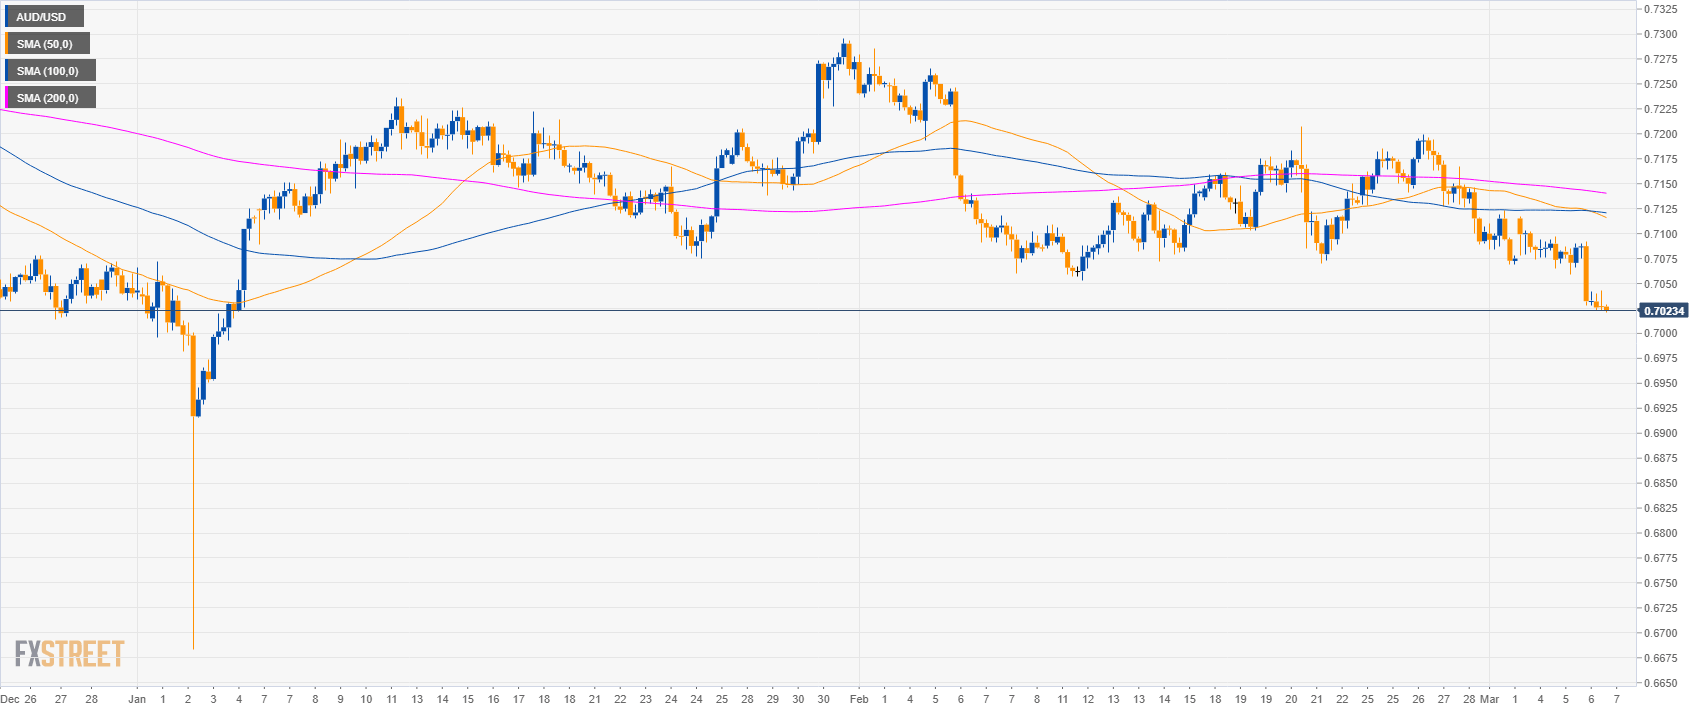
AUD/USD 4-hour chart
- AUD/USD is trading below its main SMAs suggesting bearish momentum in the medium-term.
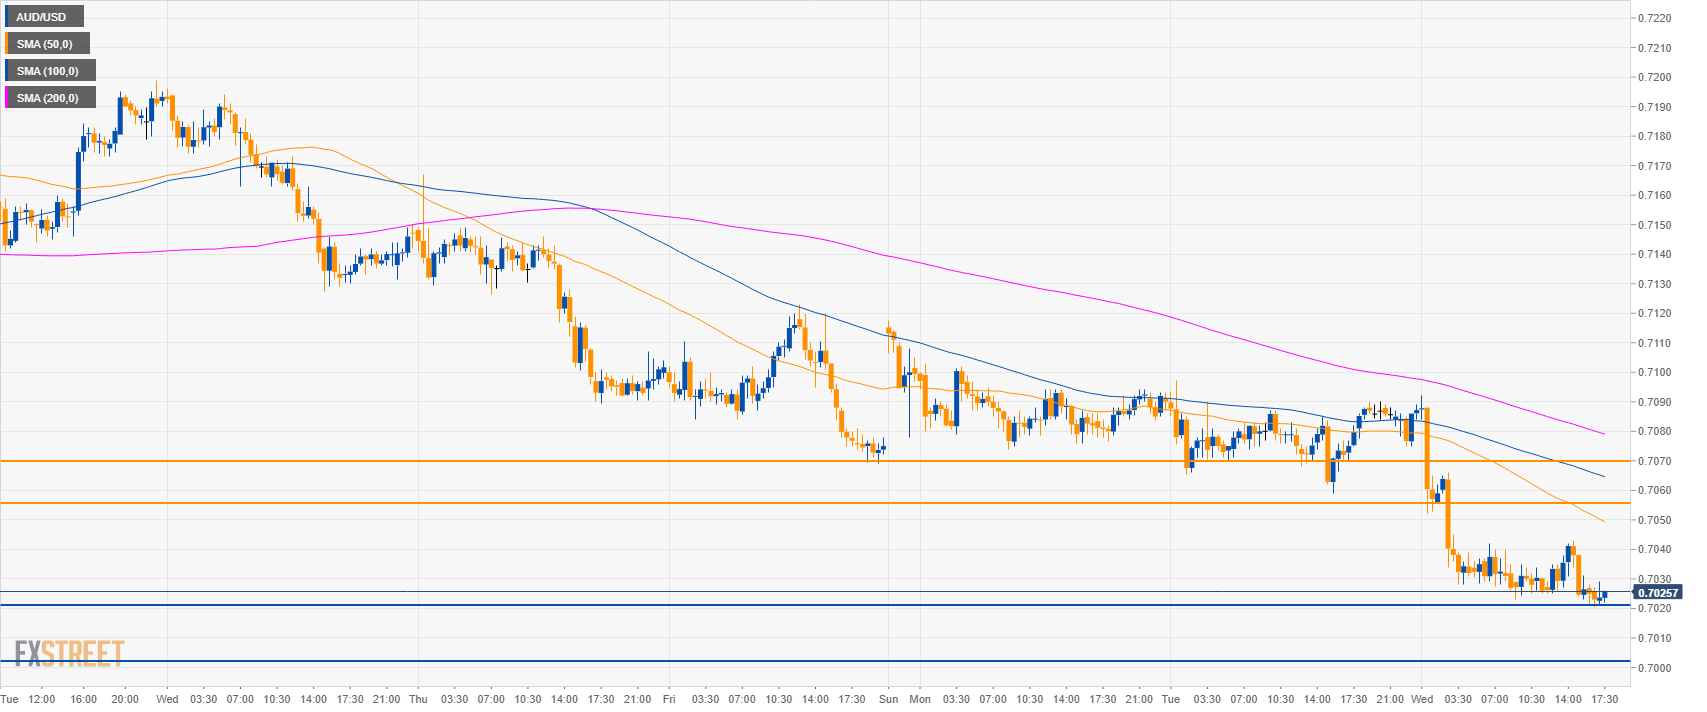
AUD/USD 30-minute chart
- A break below 0.7020 would lead to a drop to 0.7000 the figure.
- Resistances to the upside are at 0.7055 and 0.7070 level.
Additional key levels
AUD/USD
Overview:
Today Last Price: 0.7024
Today Daily change: -62 pips
Today Daily change %: -0.87%
Today Daily Open: 0.7086
Trends:
Daily SMA20: 0.7117
Daily SMA50: 0.7135
Daily SMA100: 0.7163
Daily SMA200: 0.7248
Levels:
Previous Daily High: 0.7097
Previous Daily Low: 0.7059
Previous Weekly High: 0.7199
Previous Weekly Low: 0.7069
Previous Monthly High: 0.7285
Previous Monthly Low: 0.7053
Daily Fibonacci 38.2%: 0.7074
Daily Fibonacci 61.8%: 0.7083
Daily Pivot Point S1: 0.7064
Daily Pivot Point S2: 0.7042
Daily Pivot Point S3: 0.7026
Daily Pivot Point R1: 0.7103
Daily Pivot Point R2: 0.7119
Daily Pivot Point R3: 0.7141
