- AUD/USD is bouncing from the 2019 low after several days of intense selling.
- The selling pressure persists on the Aussie as bulls fail to generate any meaningful recovery for now.
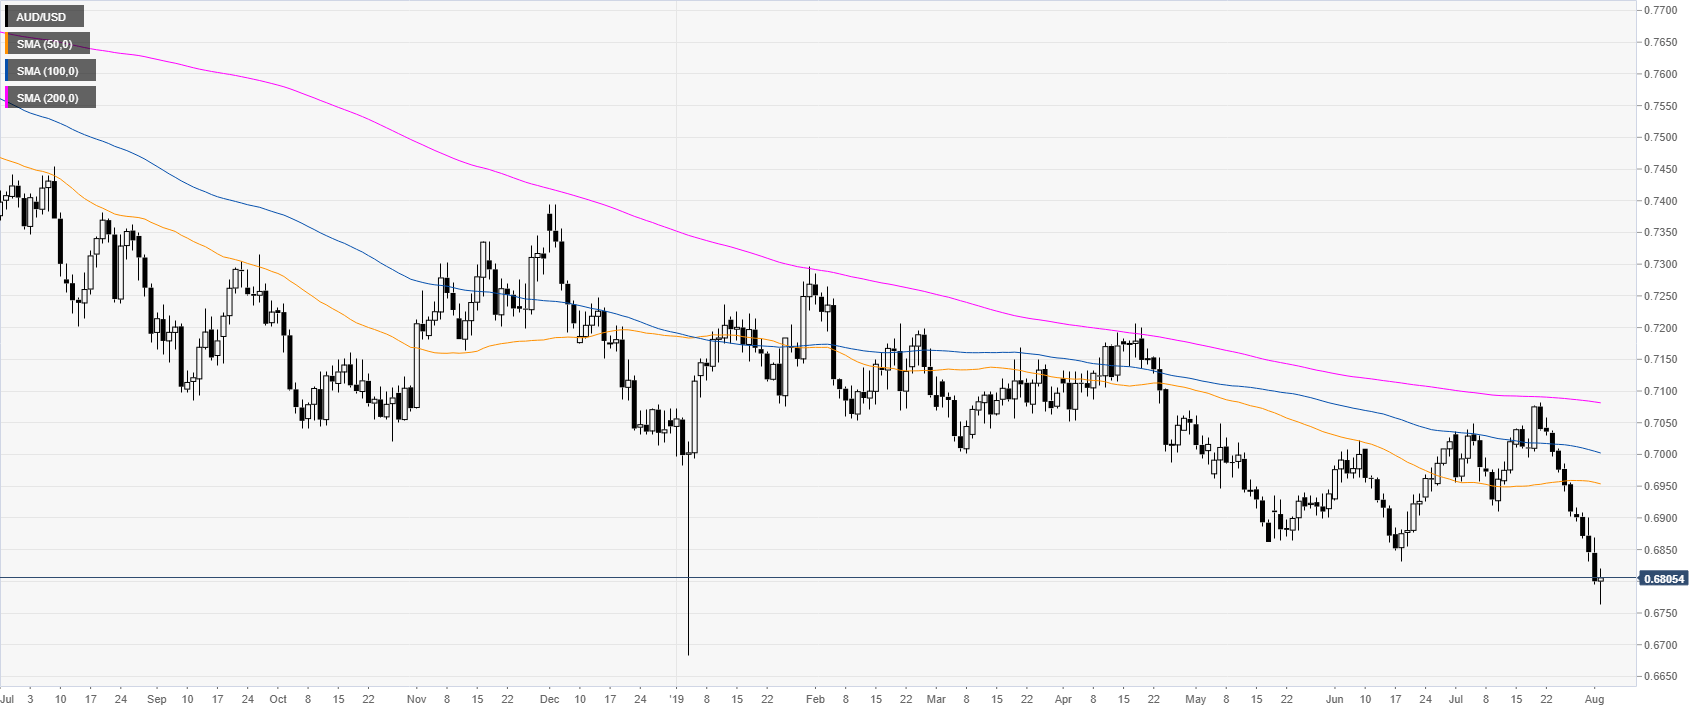
AUD/USD daily chart
The Aussie is trading in a bear trend below the main daily simple moving averages (DSMAs). The market is correcting up after reaching a new 2019 low at the 0.6763 level this Friday.
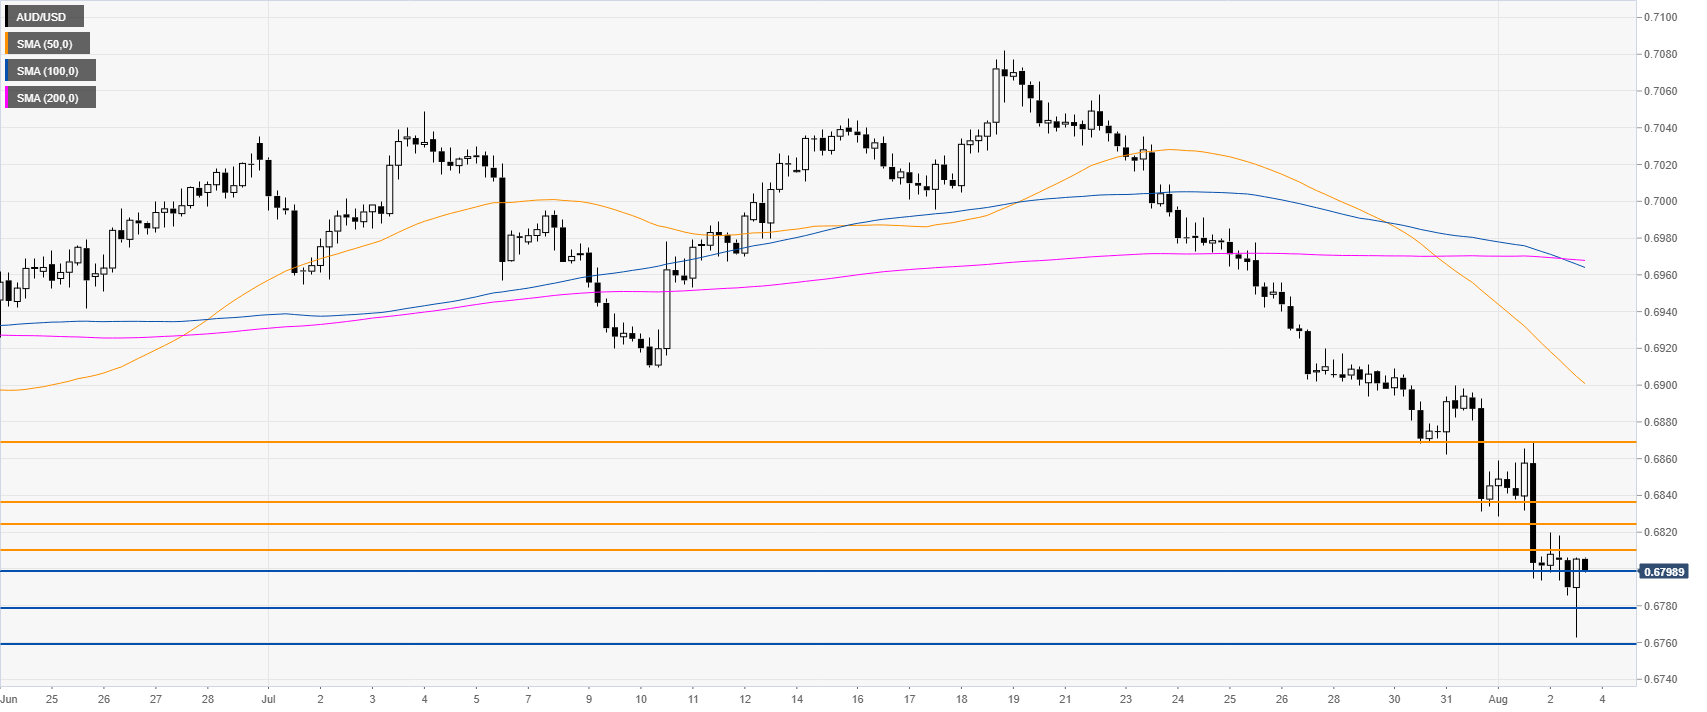
AUD/USD 4-hour chart
The Aussie is trading in a steep bear trend below its main SMAs. Sellers want to break below 0.6798 to reach 0.6780 and 0.6759 support on the way down, according to the Technical Confluences Indicator.
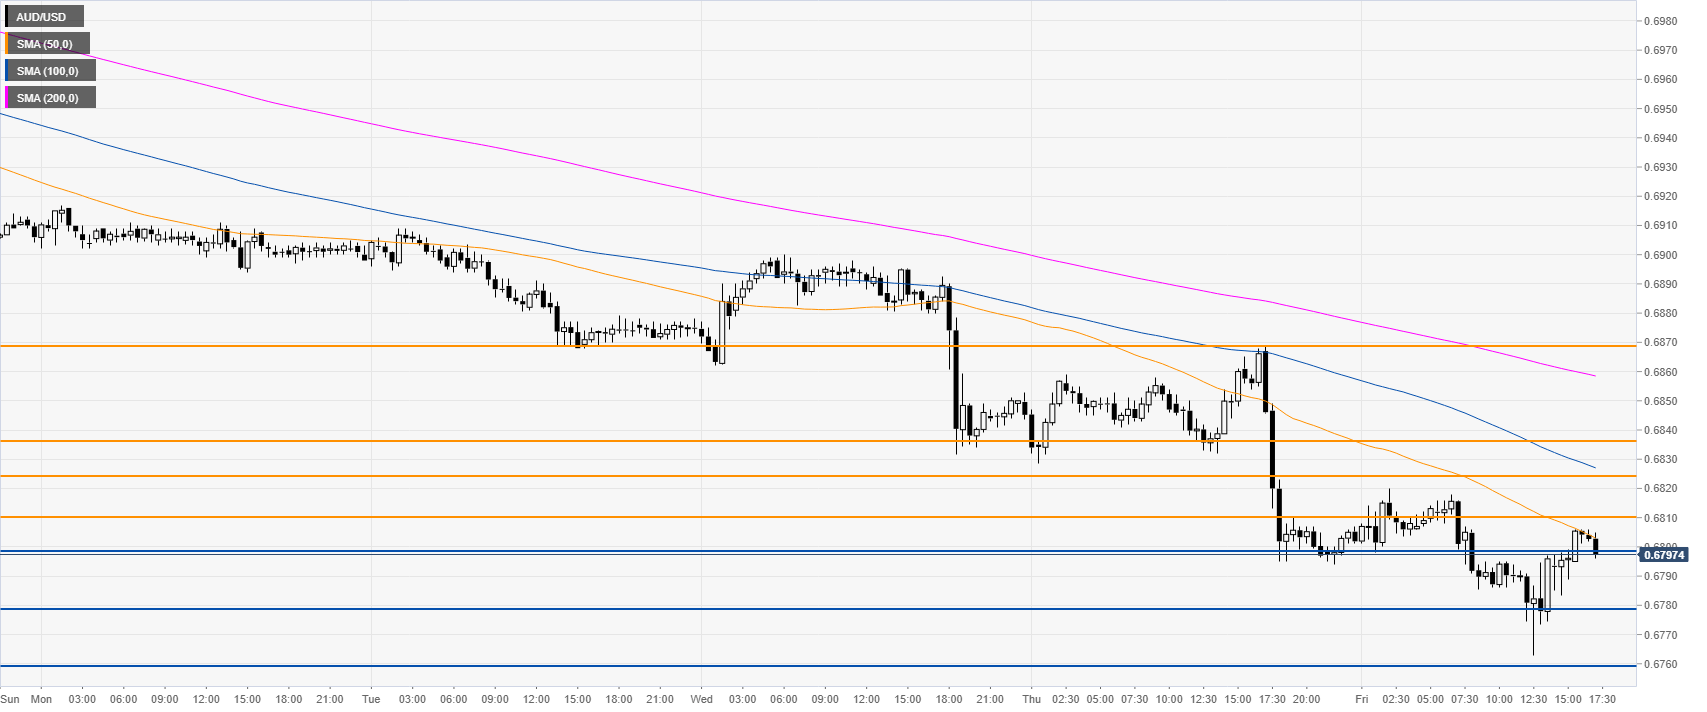
AUD/USD 30-minute chart
The bulls have tried to break above 0.6809 resistance and the 50 SMA but have not been able to pierce above it. A break above this level is necessary for bulls to reach 0.6823, 0.6837, 0.6868 resistances on the way up.
Additional key levels
