- AUD/USD is bouncing from the 2019 low after two weeks of intense selling.
- Above 0.6862, the correction can extend towards 0.6890 and 0.6930 resistances.
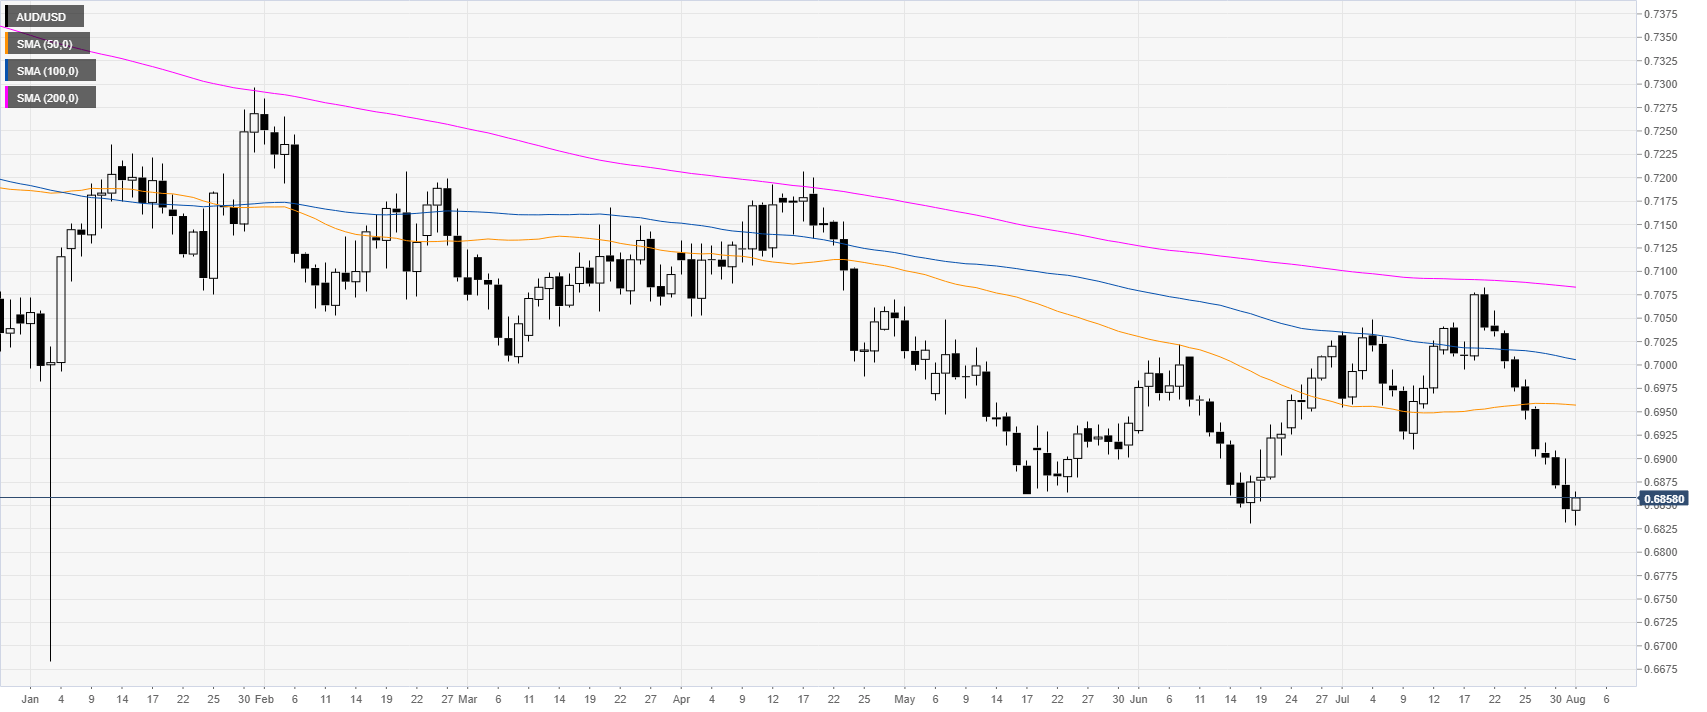
AUD/USD daily chart
The Aussie is trading in a bear trend below its main daily simple moving averages (DSMAs). The market is correcting up after reaching a new 2019 low at the 0.6828 level.
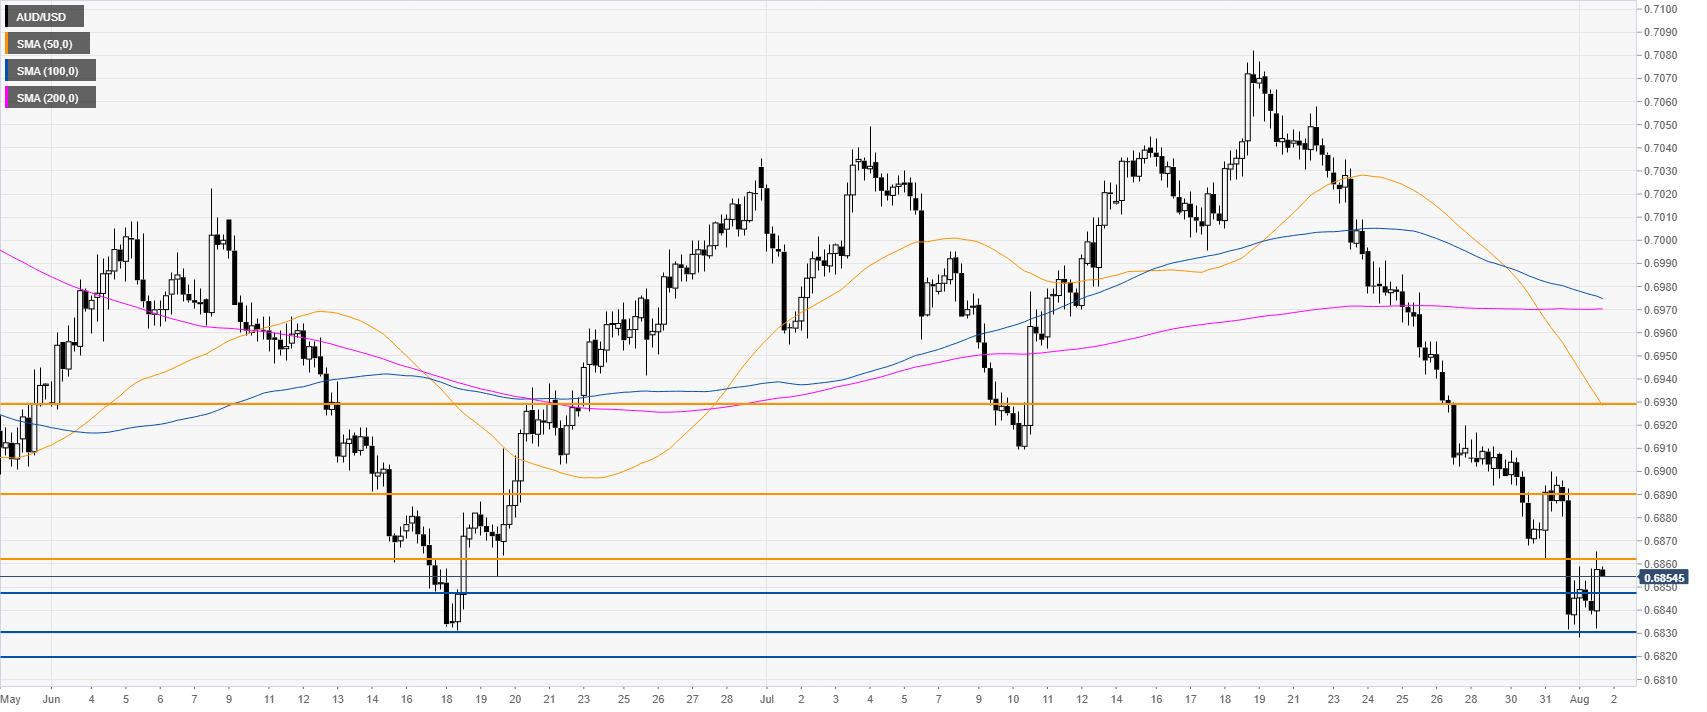
AUD/USD 4-hour chart
The Aussie is trading below its main SMAs as the market is challenging the June lows. Sellers would need to overcome 0.6847 support to continue the downward trajectory towards the 0.6830 and 0.6819 level, according to the Technical Confluences Indicator.
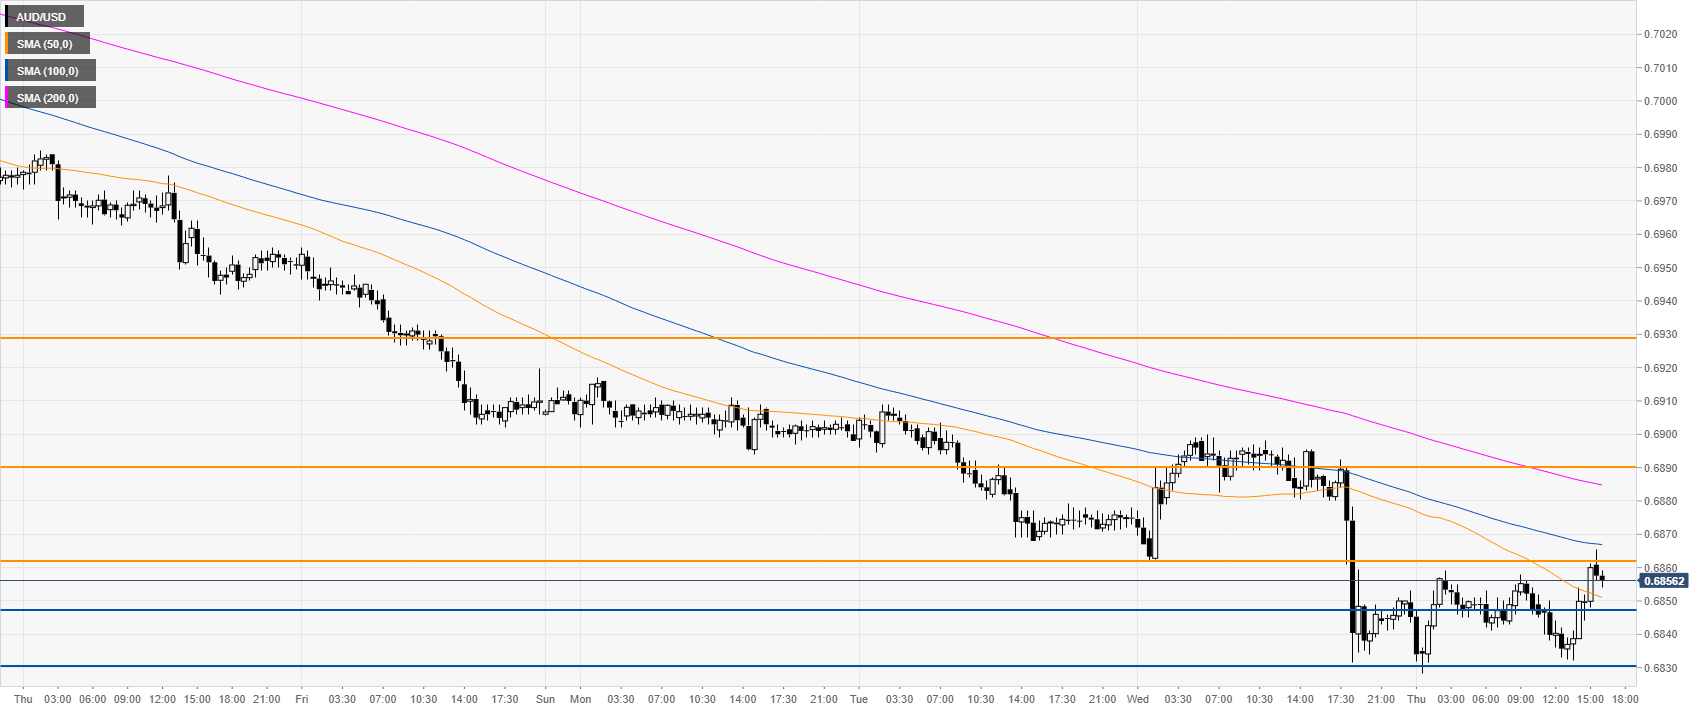
AUD/USD 30-minute chart
The market is challenging the 0.6862 resistance and the 50 SMA. A break above this level can open the doors to a more significant correction towards 0.6890 and 0.6930, according to the Technical Confluences Indicator.
Additional key levels
