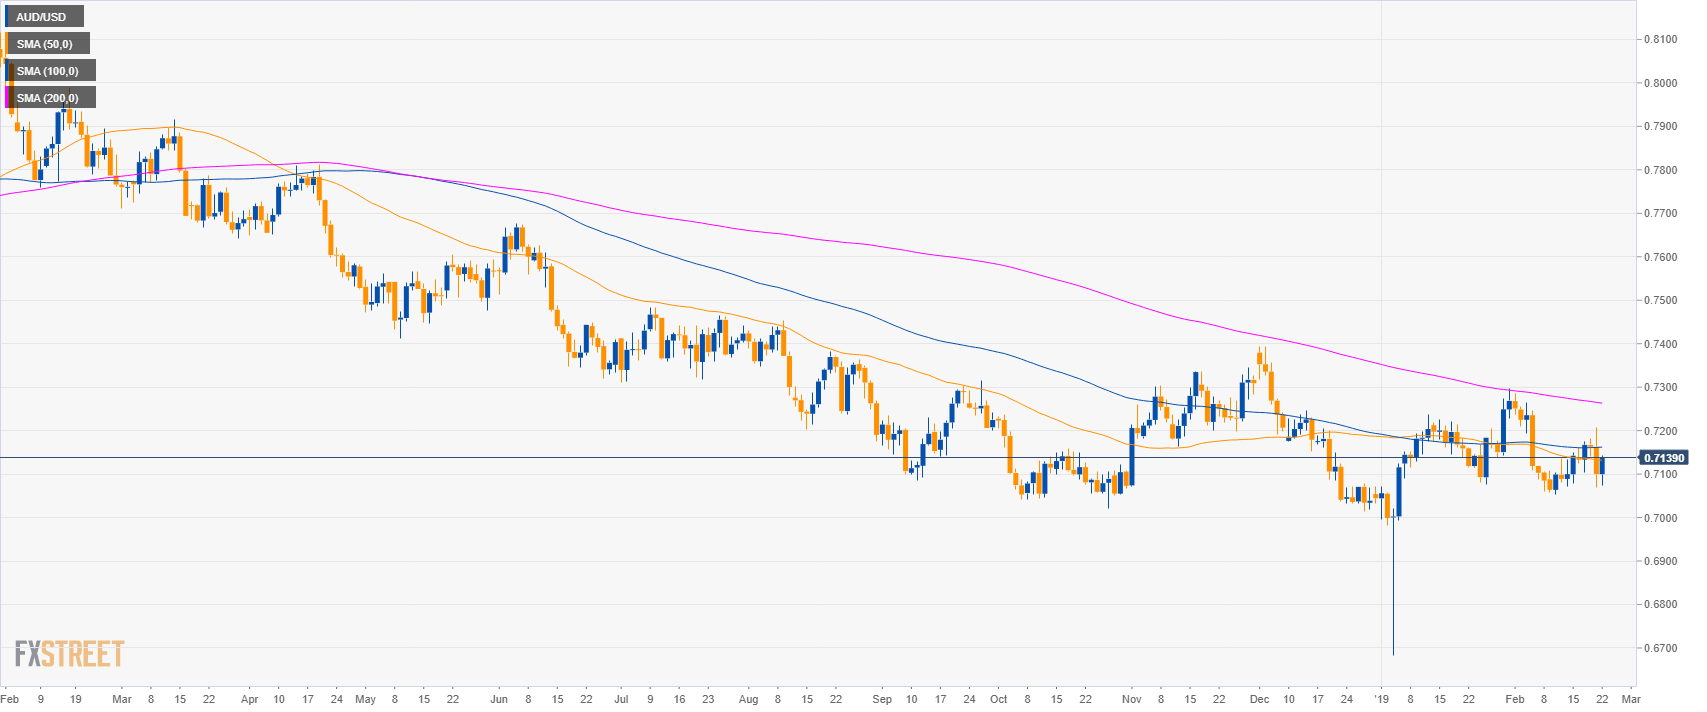
AUD/USD daily chart
- AUD/USD is trading in a bear trend below the 200-day simple moving averages (SMA).
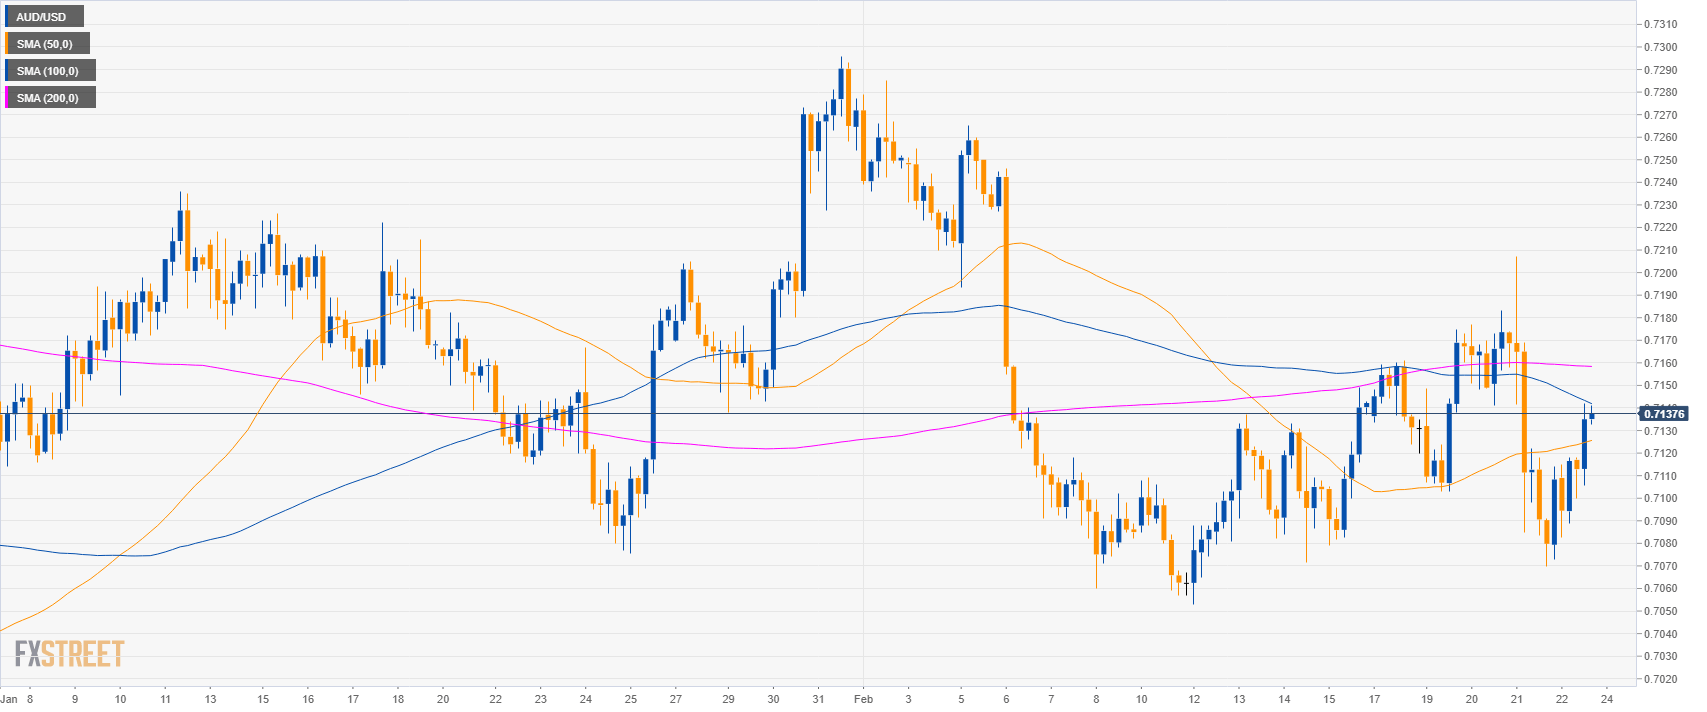
AUD/USD 4-hour chart
- AUD/USD is trading above the 0.7100 figure.
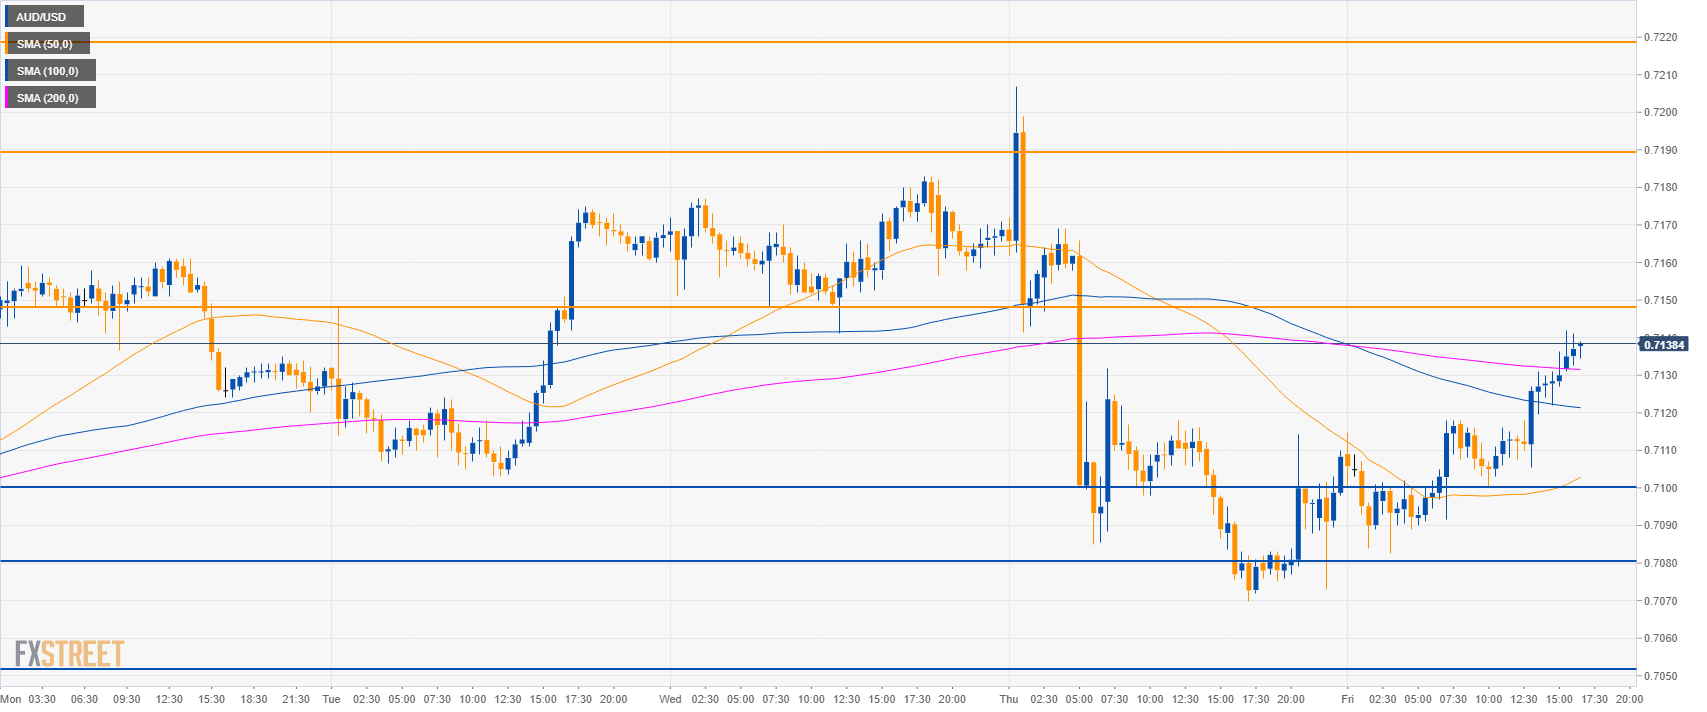
AUD/USD 30-minute chart
- AUD/USD is trading above its main SMAs suggesting bullish momentum in the short-term.
- Bulls need to overcome 0.7150 level to reach 0.7190 and 0.7220 to the upside.
- Support is at 0.7100 figure and 0.7080 level.
Additional key levels:
AUD/USD
Overview:
Today Last Price: 0.7137
Today Daily change: 37 pips
Today Daily change %: 0.52%
Today Daily Open: 0.71
Trends:
Daily SMA20: 0.7155
Daily SMA50: 0.7133
Daily SMA100: 0.7161
Daily SMA200: 0.7265
Levels:
Previous Daily High: 0.7207
Previous Daily Low: 0.707
Previous Weekly High: 0.7149
Previous Weekly Low: 0.7053
Previous Monthly High: 0.7296
Previous Monthly Low: 0.6684
Daily Fibonacci 38.2%: 0.7122
Daily Fibonacci 61.8%: 0.7155
Daily Pivot Point S1: 0.7044
Daily Pivot Point S2: 0.6988
Daily Pivot Point S3: 0.6907
Daily Pivot Point R1: 0.7181
Daily Pivot Point R2: 0.7263
Daily Pivot Point R3: 0.7318
