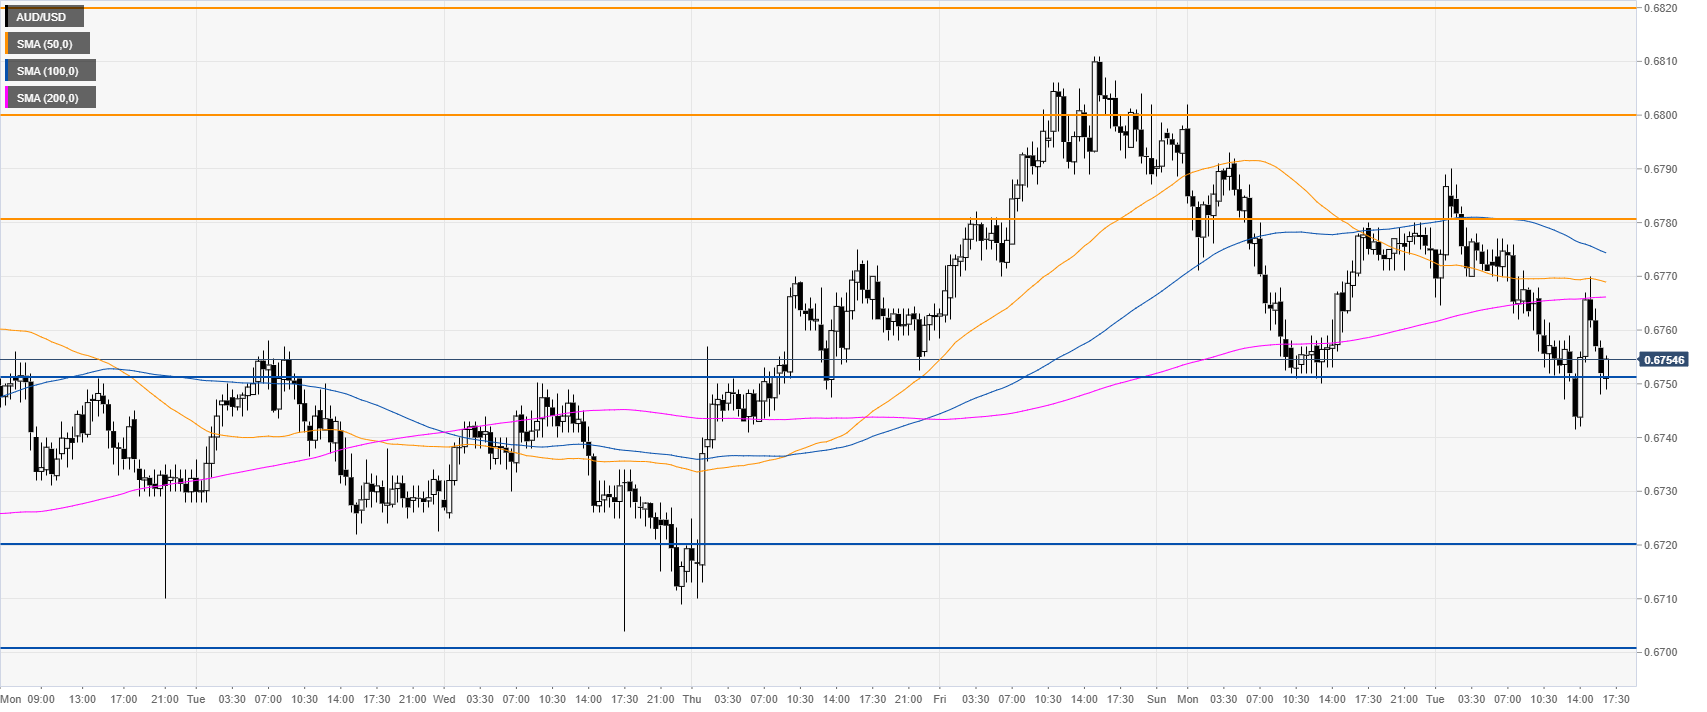
- The Aussie is trading near the 0.6750 after the London close.
- The level to beat for bears is the 0.6750 level, followed by 0.6720.
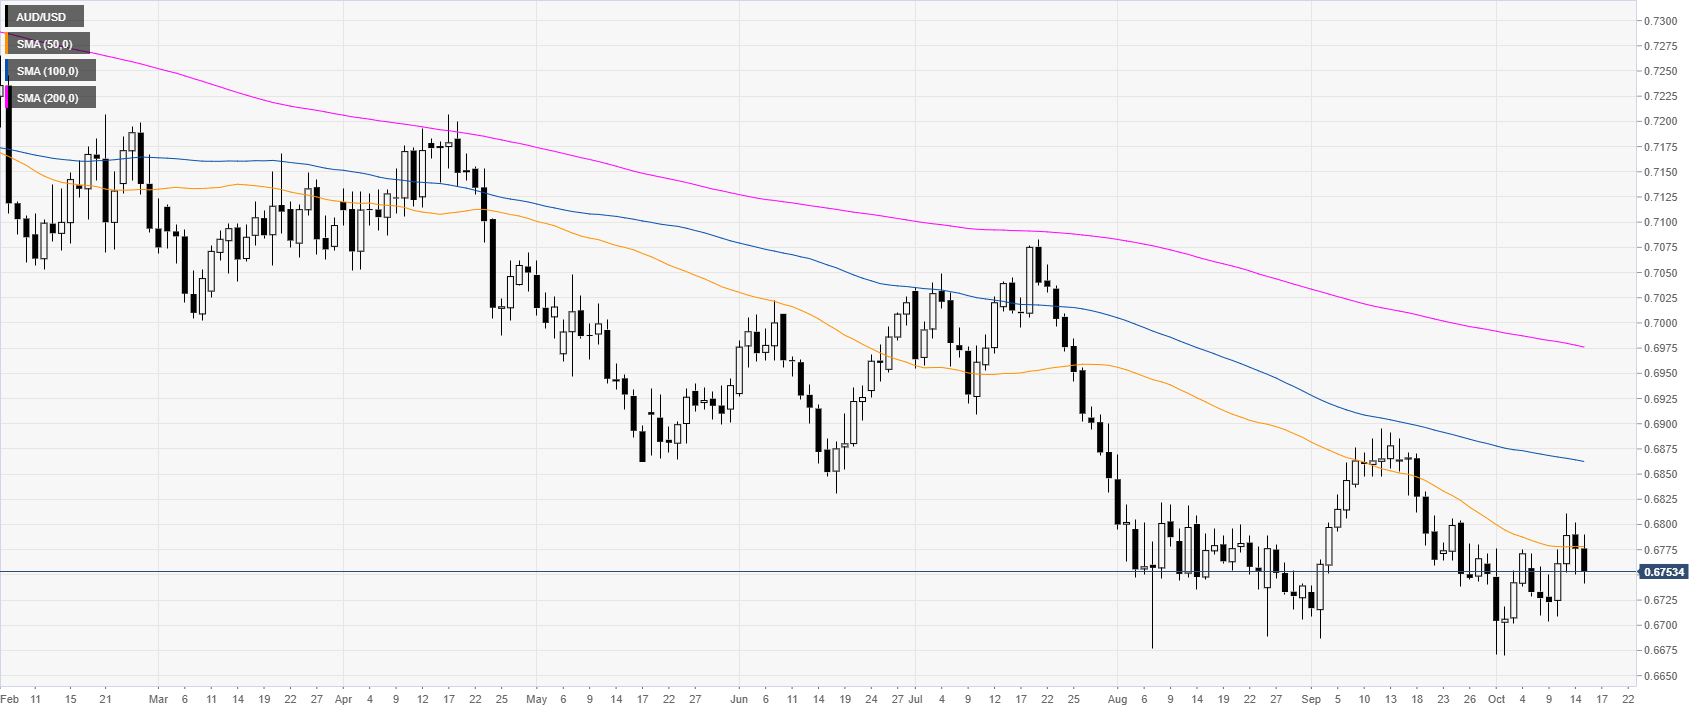
AUD/USD daily chart
The Aussie is trading in a downtrend below its main daily simple moving averages (SMAs) on the daily chart.
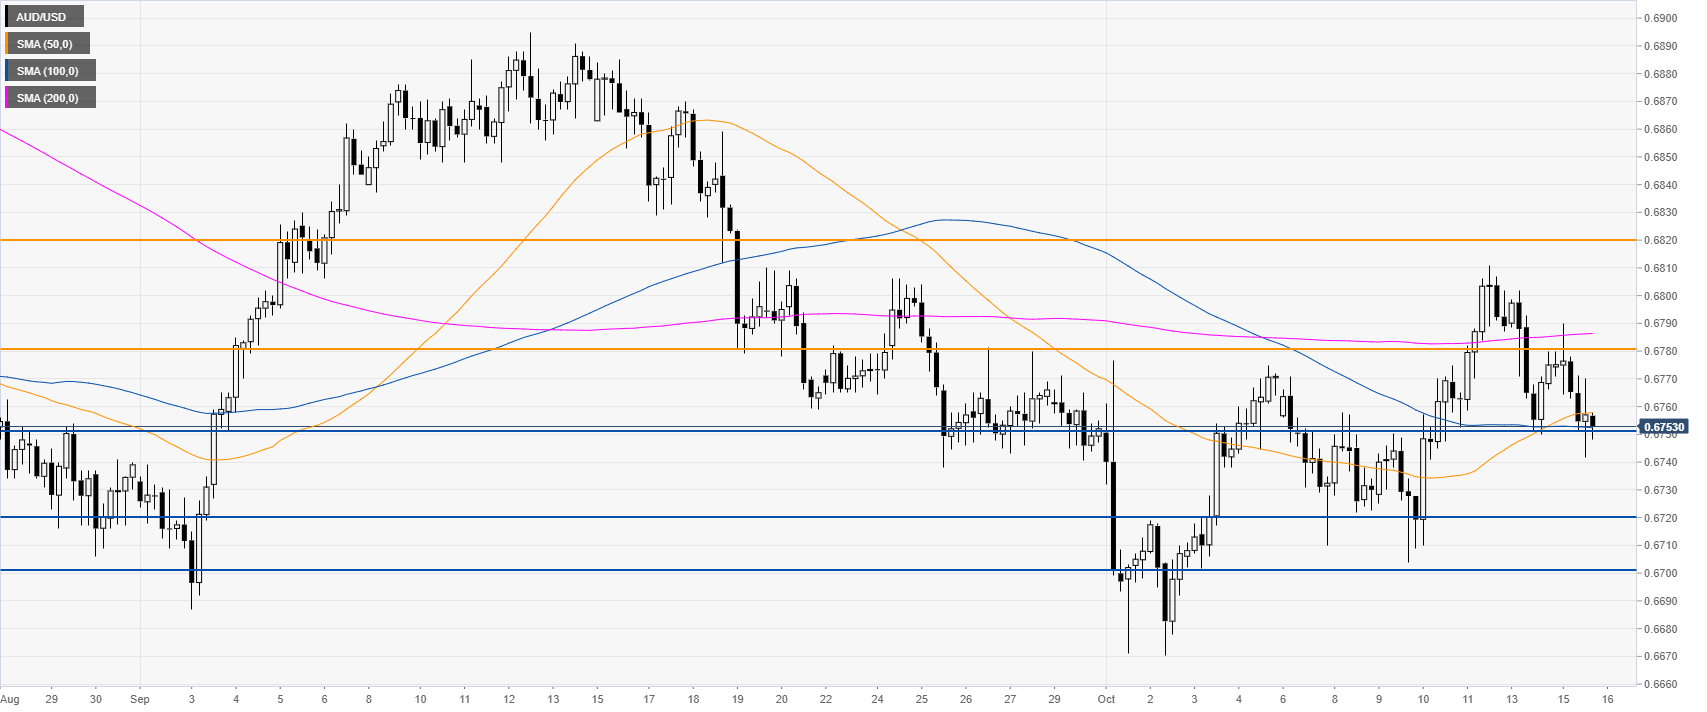
AUD/USD 4-hour chart
The market is trading between the 50 and 100 SMAs, suggesting a sideways market in the medium term. The spot is challenging the 0.6750 support. A break below the level can see the Aussie moving down to the 0.6720 level, according to the Technical Confluences Indicator.
AUD/USD 30-minute chart
AUD/USD is trading below the main SMAs on the 30-minute chart, suggesting a bearish bias in the near term. Resistance is seen at the 0.6780 and 0.6800 price levels.
Additional key levels
