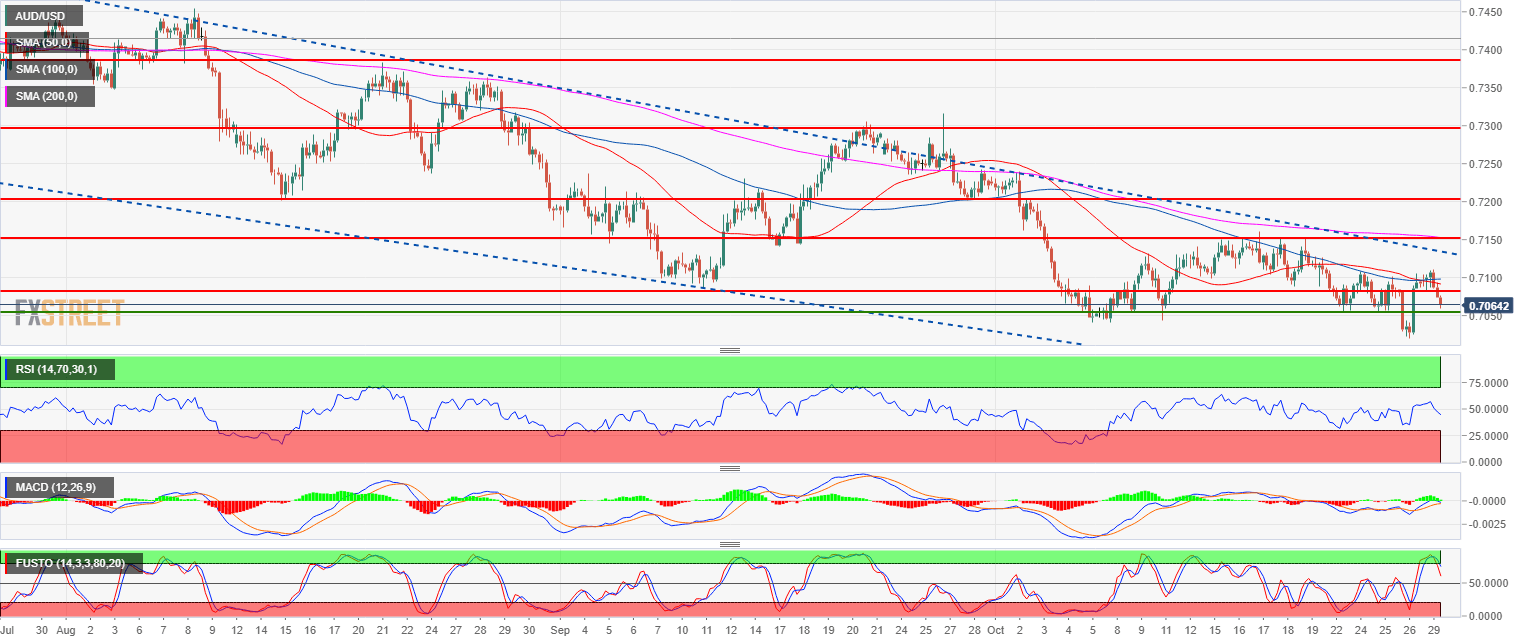
- AUD/USD is trading in a bear trend below the 200-period simple moving average on the 4-hour chart.
- AUD/USD bears are rejecting the 0.7100 figure along with the 50 and 100-period simple moving average. The path of least resistance is to the downside suggesting that a break of the 0.7050 support might lead to a retest of the 2018 low at the 0.7020 level.
- A break above 0.7100 on a daily closing basis would invalidate the bearish bias.
AUD/USD 4-hour chart
Main trend: Bearish
Resistance 1: 0.7085, September 11 low
Resistance 2: 0.7100 figure
Resistance 3: 0.7144 September 5 low
Resistance 4: 0.7174-0.7200 zone, 200 SMA (4H) and August 15 low
Resistance 5: 0.7300 figure
Support 1: 0.7050 figure
Support 2: 0.7041 key support/resistance
Support 3: 0.7020 current 2018 low
Support 4: 0.6830 January 15, 2016 low
Additional key levels at a glance
AUD/USD
Overview:
Last Price: 0.7064
Daily change: -29 pips
Daily change: -0.409%
Daily Open: 0.7093
Trends:
Daily SMA20: 0.7106
Daily SMA50: 0.7186
Daily SMA100: 0.7292
Daily SMA200: 0.7513
Levels:
Daily High: 0.7106
Daily Low: 0.702
Weekly High: 0.7128
Weekly Low: 0.702
Monthly High: 0.7316
Monthly Low: 0.7085
Daily Fibonacci 38.2%: 0.7073
Daily Fibonacci 61.8%: 0.7053
Daily Pivot Point S1: 0.704
Daily Pivot Point S2: 0.6988
Daily Pivot Point S3: 0.6954
Daily Pivot Point R1: 0.7126
Daily Pivot Point R2: 0.7159
Daily Pivot Point R3: 0.7211
