- The Aussie is trading near its lowest point since the start of the week.
- The level to beat for bears is the 0.6795 support.
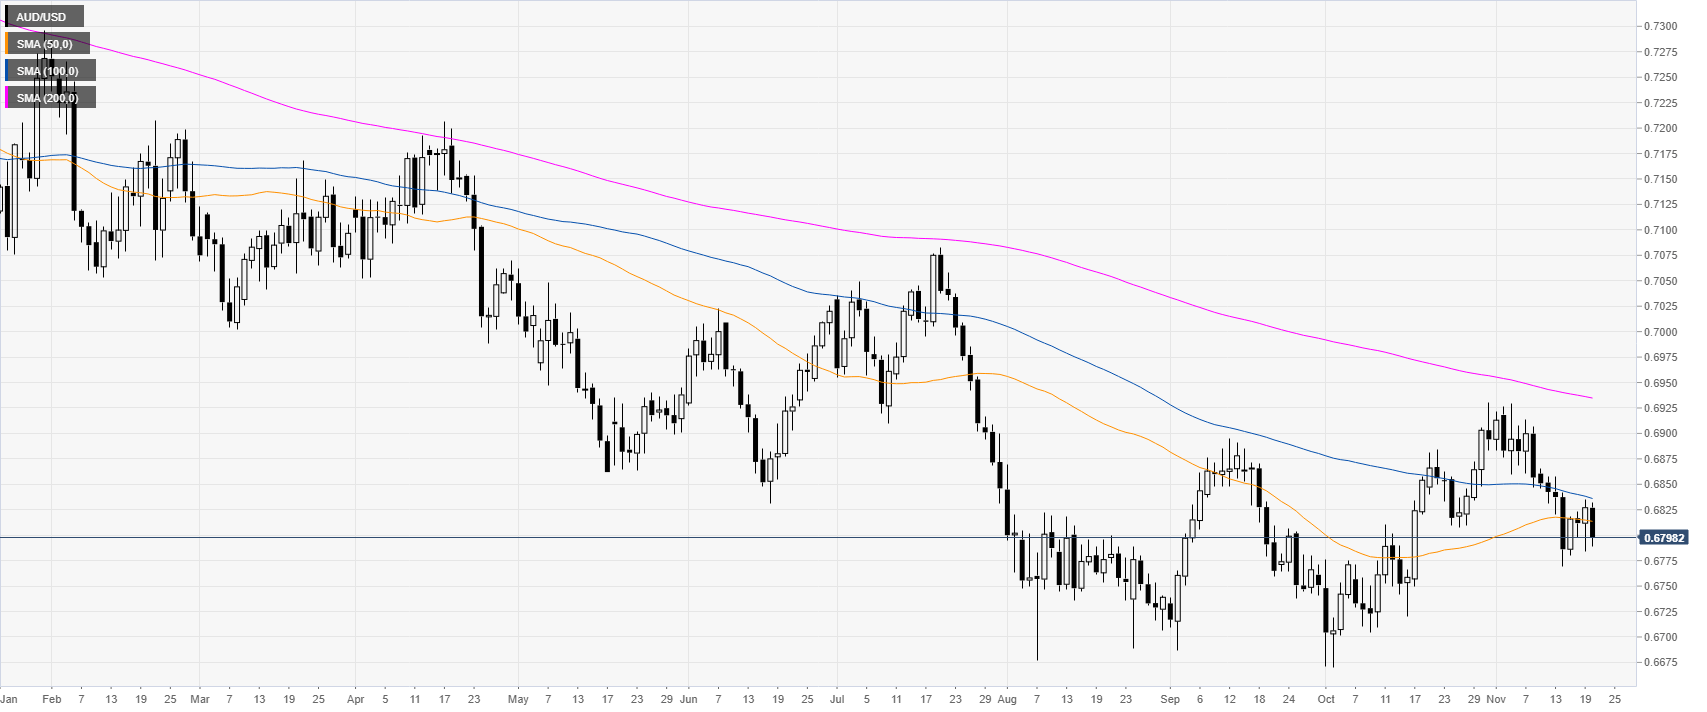
AUD/USD daily chart
AUD/USD is trading in a downtrend below the main daily simple moving averages (DMAs) on the daily chart. FOMC minutes: Most policymakers said rate cut was warranted due to global weakness.
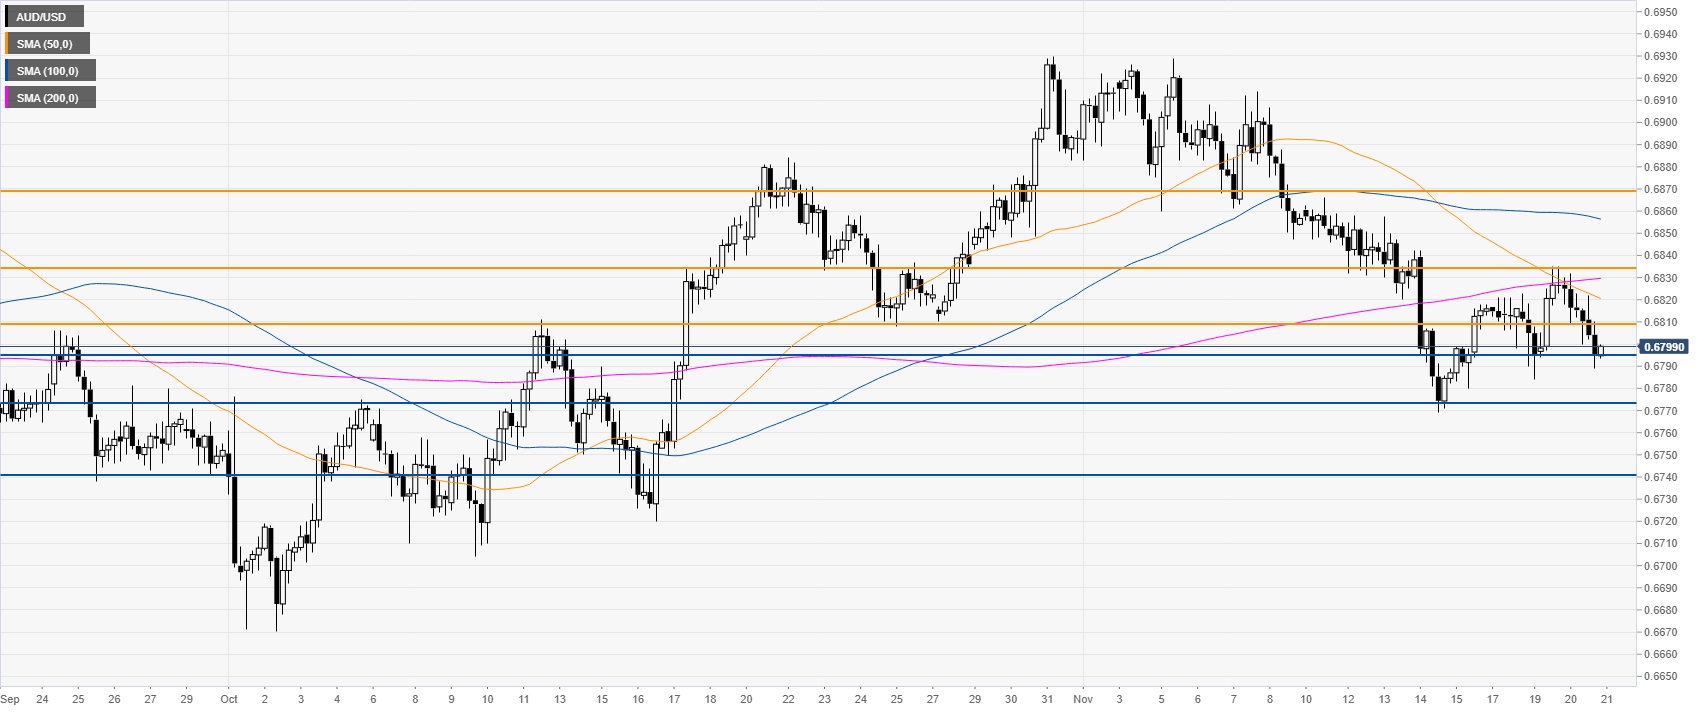
AUD/USD 4-hour chart
The market is under pressure below its main SMAs near the November lows. The spot is currently sitting near the 0.6795 support level. A break below it can lead to 0.6773 (swing low) and to the 0.6740 level, according to the Technical Confluences Indicator.
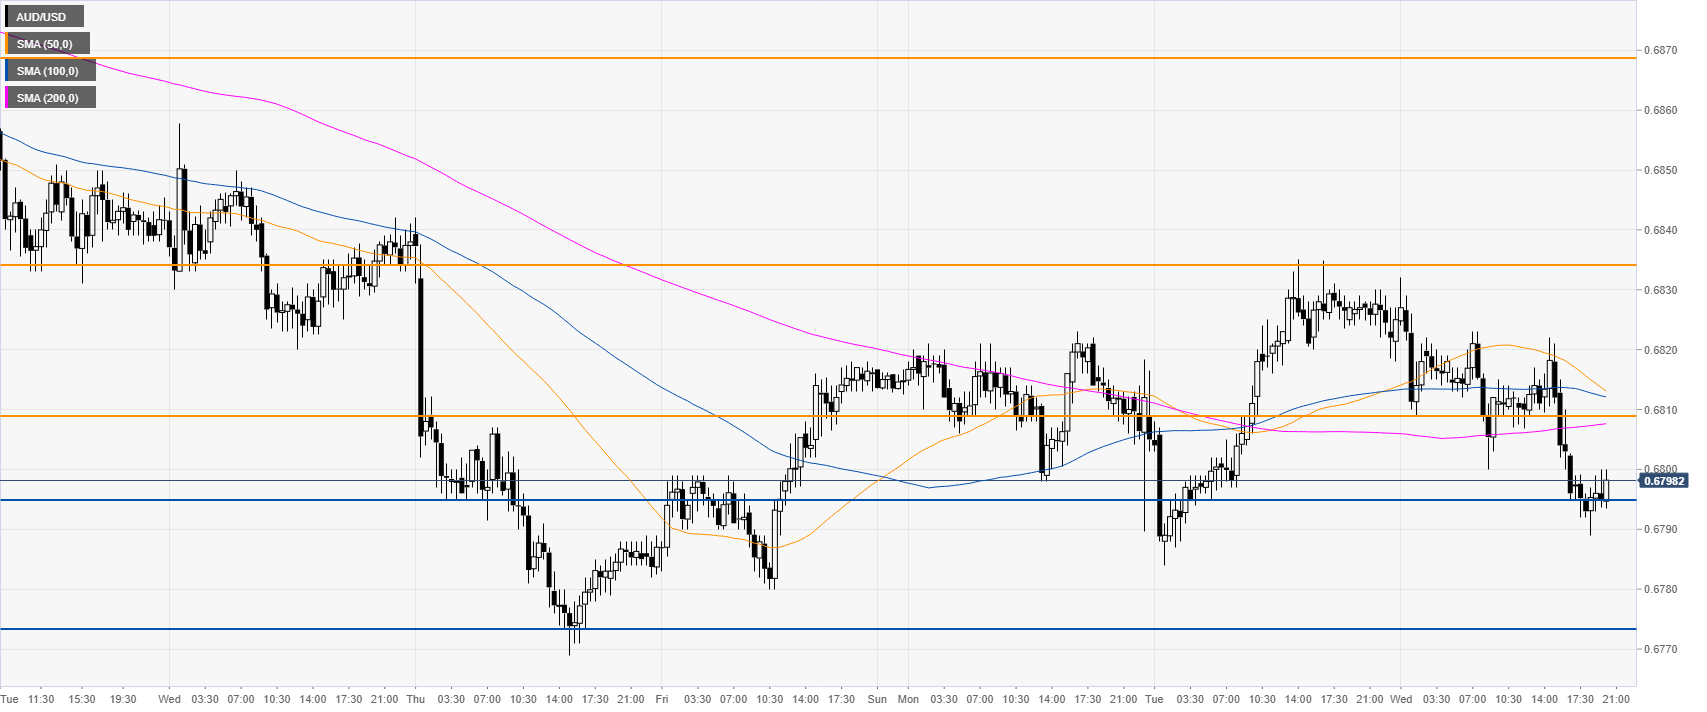
AUD/USD 30-minute chart
AUD/USD is trading at weekly lows below its main SMAs, suggesting a bearish bias. Resistances are seen at the 0.6810, 0.6834 and 0.6868 price levels, according to the Technical Confluences Indicator.
Additional key levels
