- AUD/USD is meeting resistance at the 21-hr SMA with bulls supporting at S3.
- Hourly RSI is holding back above 30.
- The price is stalling for the third time since having broken below the late Feb bullish cloud and the lagging span is en-route to price, pointing to another phase of consolidation.
- While short-term momentum indicators are overstretched, the daily RSI has further to go as price develops below the trendline resistance est. on 25th Feb with a series of touches on the way down to the cloud.
- The price is now below the daily bullish cloud although the Senkou Span A has not yet crossed below the Senkou Span B.
- However, the bias remains bearish while the price is below the horizontal support line est. on 11th Feb swing lows at 0.7053. A break of 0.7016 26th Dec lows.
- Weekly S2 is located at 0.6986 and S3 at 0.6903 meeting 22 Aug 2015.
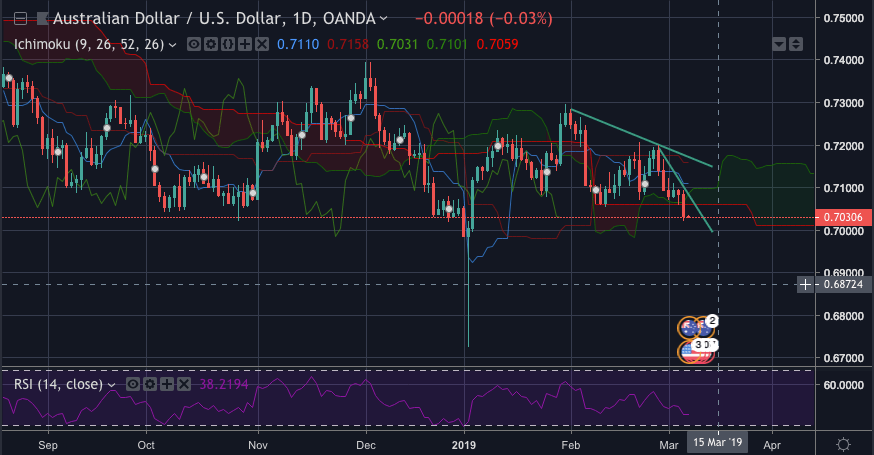
AUD/USD daily chart
