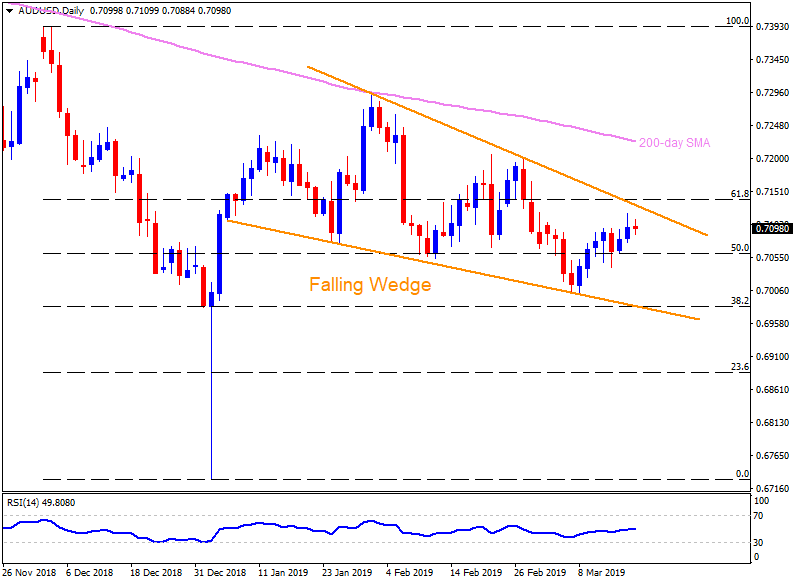
AUD/USD daily chart
- The AUD/USD pair is on bids around 0.7100 mark ahead of European sessions on Tuesday.
- Considering the quote’s moves since early January, a “falling wedge” bullish formation is underway that gets confirmed if prices cross 0.7135 resistance.
- With this, pair can theoretically rise towards 0.7350 with a 200-day simple moving average (SMA) at 0.7225 and 0.7200 acting as intermediate halts.
- Alternatively, 50% Fibonacci retracement near 0.7060, followed by 0.7000, can limit near-term declines ahead of highlighting pattern support of 0.6980.
- In a case where prices slide under 0.6980, 0.6930, 0.6900 and 0.6825/30 can please sellers.
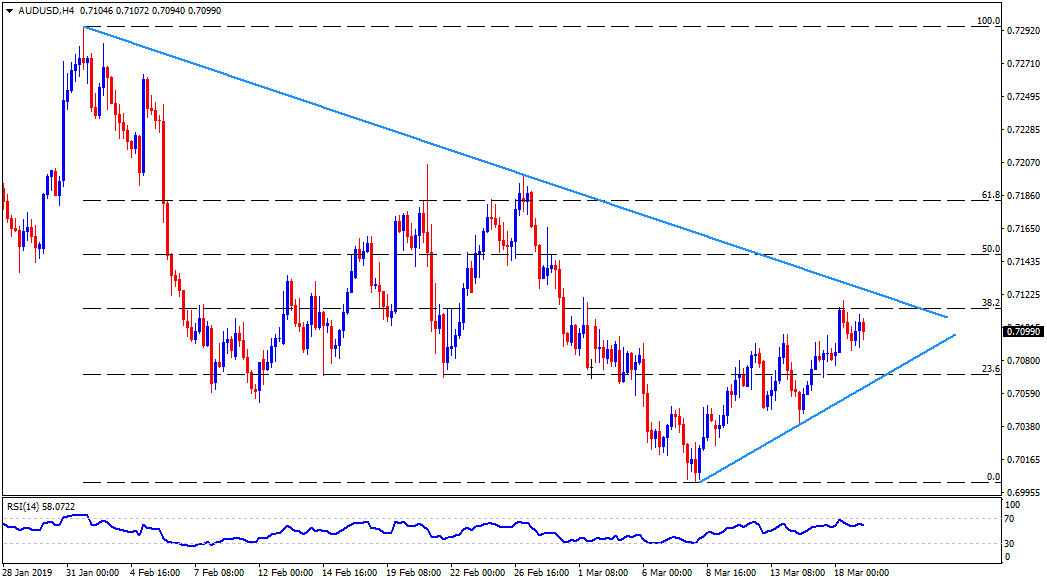
AUD/USD 4-Hour chart
- 0.7150 could offer an intermediate halt between 0.7135 and 0.7200.
- On the downside, 0.7020 might act as a buffer amid 0.7060 and 0.7000.

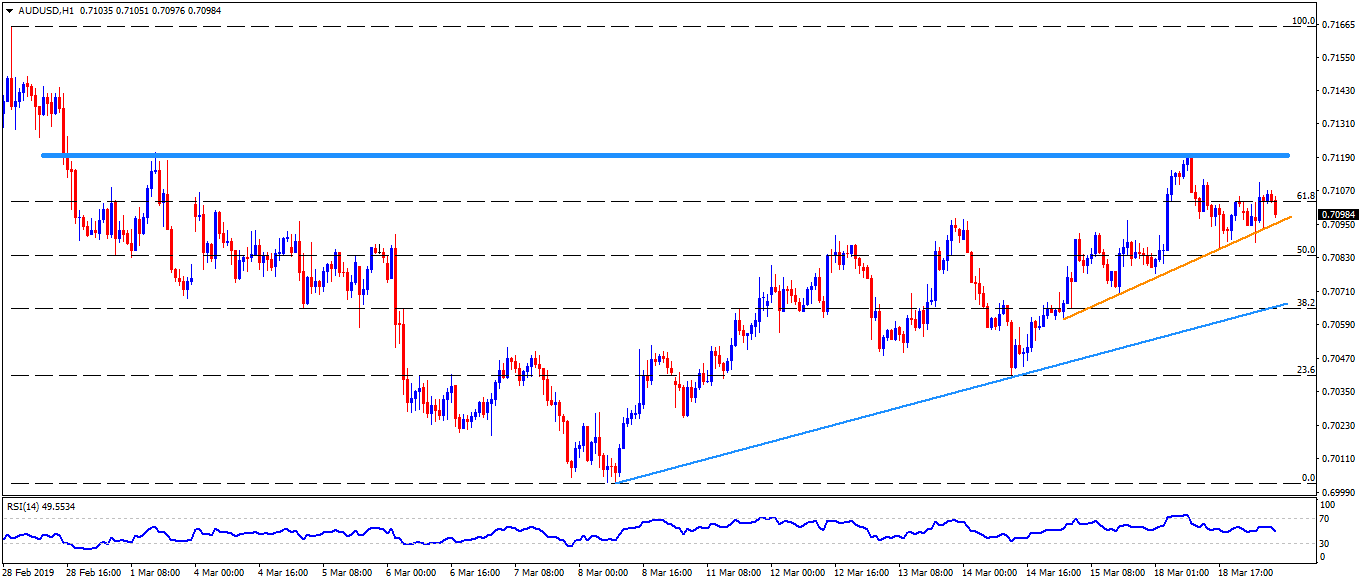
AUD/USD hourly chart
- 0.7118-20 horizontal-area becomes the closest resistance to watch.
- Adjacent upward sloping support-line at 0.7095 seems nearby support.