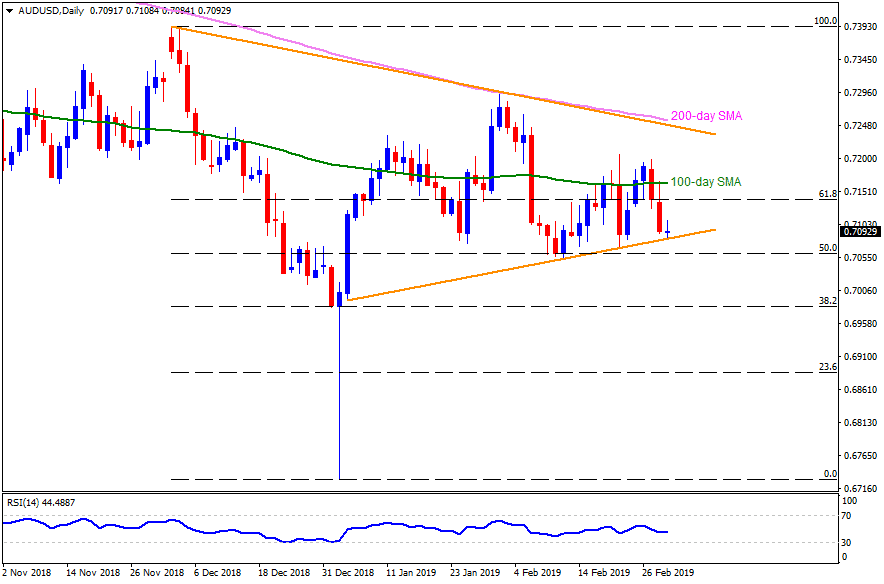
AUD/USD daily chart
- The Australian Dollar (AUD) trades near 0.7095 against the US Dollar (USD) during early Asian sessions on Friday.
- The pair recently dropped to an eight-week-old ascending support-line at 0.7080.
- If the USD strength drags the quote under 0.7080, it can quickly revisit 0.7055 and 0.7030 support levels whereas 0.7000 and 0.6980 may limit the downside then after.
- During the pair’s U-turn, 0.7125, 61.8% Fibonacci retracement of its December – January plunge, at 0.7140, and 100-day simple moving average (SMA) figure of 0.7165 can please short-term buyers.
- In a case where prices rally above 0.7165, 0.7200 and 0.7235 could come back on the chart while a descending trend-line joining December and January highs, at 0.7250, adjacent to 200-day SMA of 0.7255, might play their role of resistances afterward.
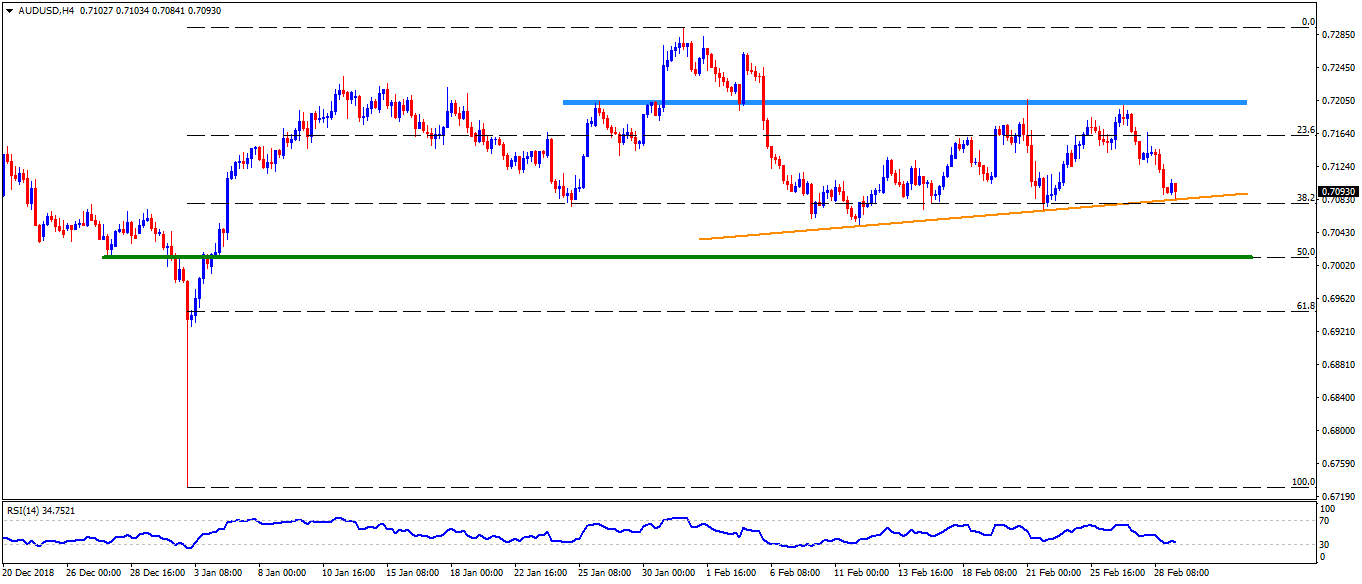
AUD/USD 4-Hour chart
- On the H4 chart, the pair has 0.7015 as an intermediate halt between 0.7030 and 0.7000.
- Also, there prevails a resistance region around 0.7200-0.7205 that may limit the pair’s nearby upside.
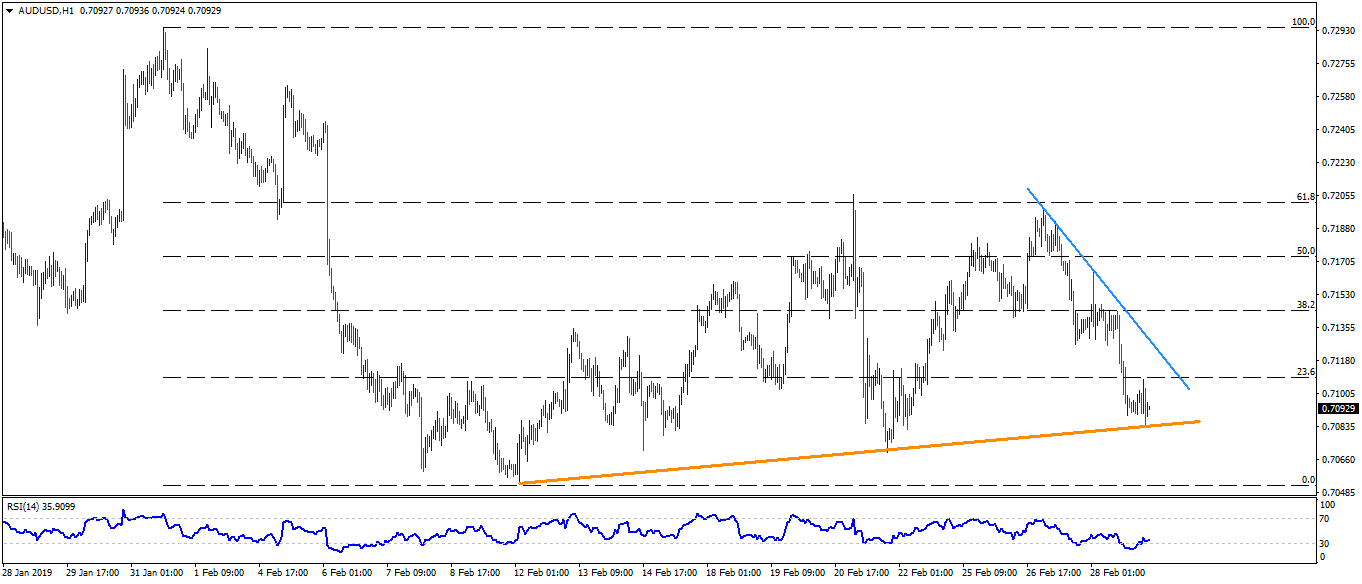
AUD/USD hourly chart
- While 0.7110 can act as adjacent resistance, a downward sloping trend-line at 0.7130 may work as additional upside stop.
- The 0.7070 may offer a rest to validate the pair’s decline beneath 0.7080 towards 0.7055.