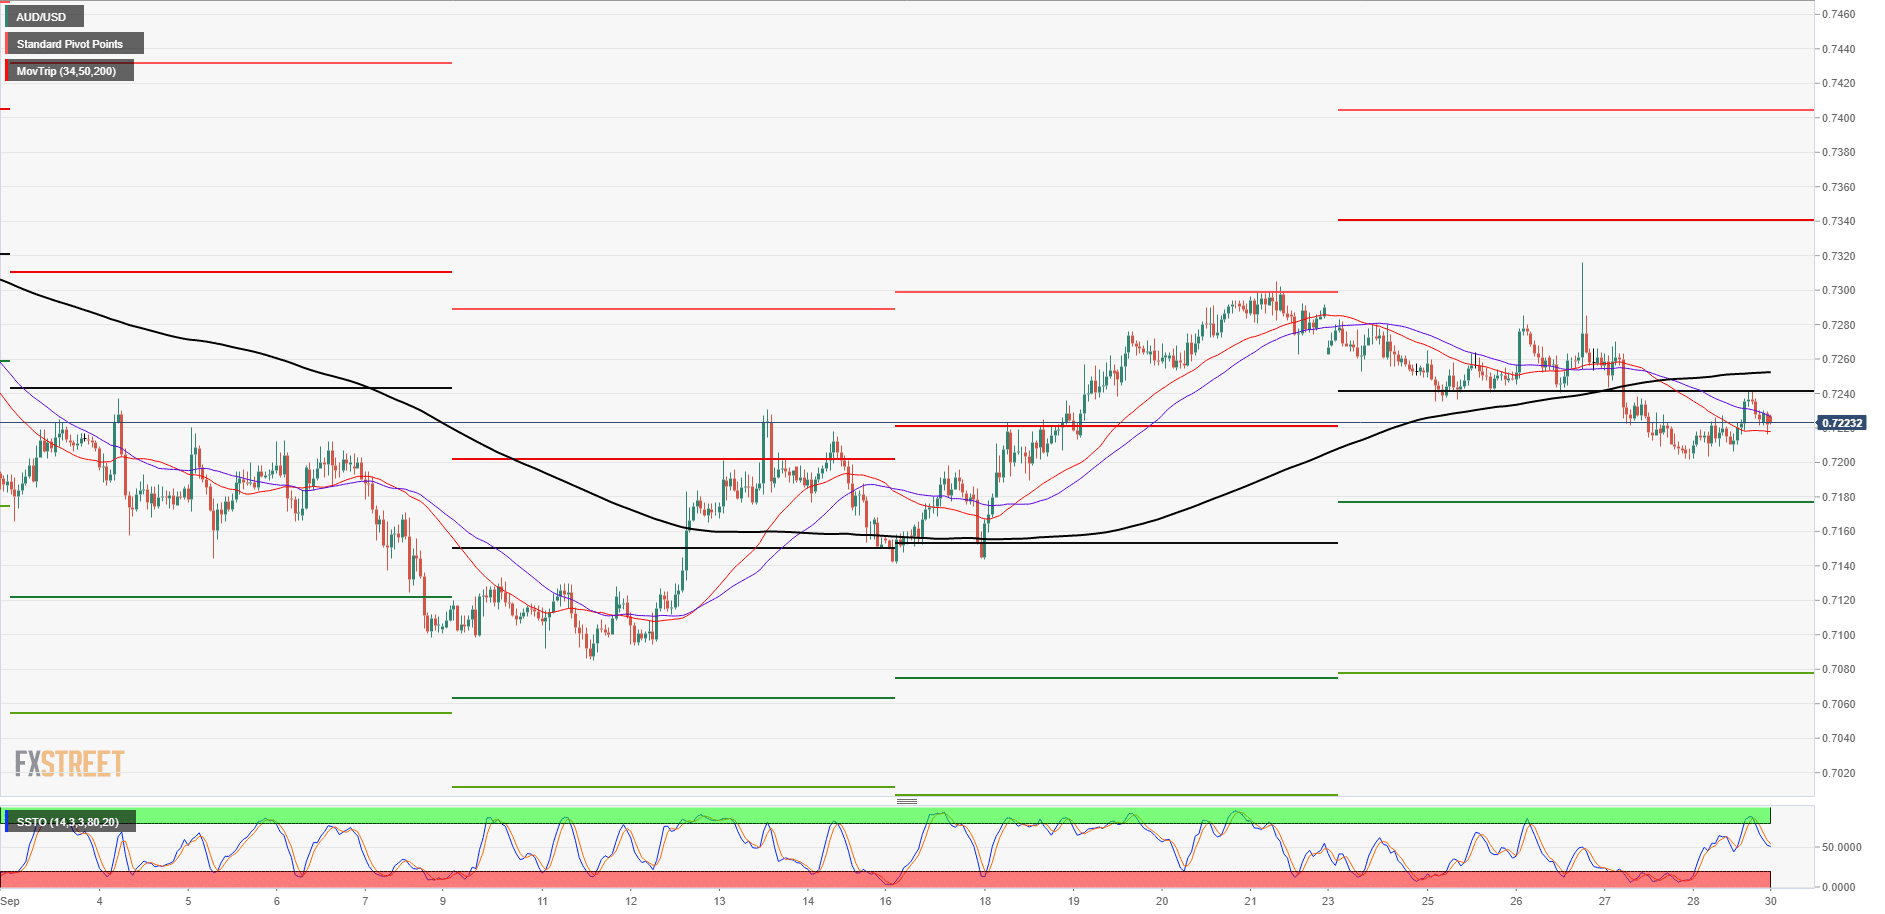
- The Aussie is continuing to drift backwards from a recent four-week high, and support from the 0.72 handle is holding for now, but under increasing pressure as the hourly Slow Stochastics gear up for another push into downside territory.
- On the 4-hour chart, the last swing low remains higher than recent action, but has still made a bearish break of a rising trendline, and sellers may begin to pile in at subsequent swing highs.
- Daily candles remain firmly in a downtrend slant, with the 50-day EMA currrently keeping prices under wraps from just beneath the 0.73 ceiling.
| Spot rate | 0.7223 |
| Previous week change | 0.26% |
| Previous week high | 0.7241 |
| Previous week low | 0.7202 |
| Support 1 | 0.7200 (major technical level) |
| Support 2 | 0.7177 (S1 weekly pivot) |
| Support 3 | 0.7077 (S2 weekly pivot) |
| Resistance 1 | 0.7242 (previous week high) |
| Resistance 2 | 0.7252 (200-hour EMA) |
| Resistance 3 | 0.7300 (major technical level) |
