- AUD/USD stays below 50% Fibonacci retracement of July-October declines.
- Bullish MACD, refrain from declining below 100-day SMA portrays the pair’s strength.
Despite taking a U-turn from 50% Fibonacci retracement, AUD/USD refrains from declining below 100-day SMA. The quote takes the bids to 0.6860 during early Wednesday.
Not only the 100-day Simple Moving Average (SMA) level of 0.6855 but bullish signals from 12-bar Moving Average Convergence and Divergence (MACD) indicator also favors the pair’s further rise.
In doing so, 50% Fibonacci retracement around 0.6880 acts as an immediate upside barrier ahead of September month high close to 0.6900.
During the pair’s further run-up below 0.6900, July month low around 0.6910 and 61.8% Fibonacci Retracement level of 0.6925 becomes the key to watch.
Meanwhile, 38.2% Fibonacci retracement level near 0.6830 and October 11 high of 0.6811 could come back on the chart if prices slip below 0.6855.
AUD/USD daily chart
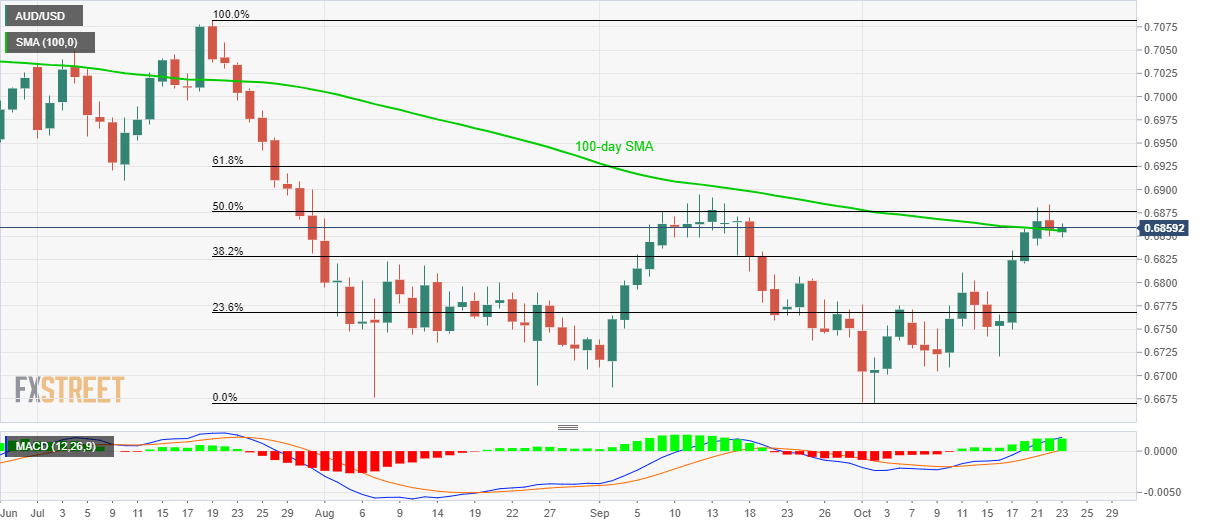
Trend: bullish
