- AUD/USD’s hourly chart shows a bullish engulfing candle.
- The hourly RSI has created higher lows, confirming a bullish divergence.
AUD/USD is looking north with signs of bearish-to-bullish trend change on the hourly chart.
To start with, the pair has created a bullish engulfing candle on the hourly chart. That candlestick Is considered an early sign of bull reversal, especially if it appears following a notable sell-off, as is the case with the AUD. The currency pair topped out at 0.7082 on July 19 and fell to a six-week low of 0.6862 earlier today.
Further, the hourly chart is now reporting a bullish divergence of the relative strength index (RSI), which occurs when the indicator charts a higher low, contradicting lower highs on the price chart.
As a result, a move above 0.69 looks likely. The bullish case would weaken if the pair finds acceptance below 0.6862, although that looks unlikely. As of writing, the pair is trading at 0.6879.
Hourly chart
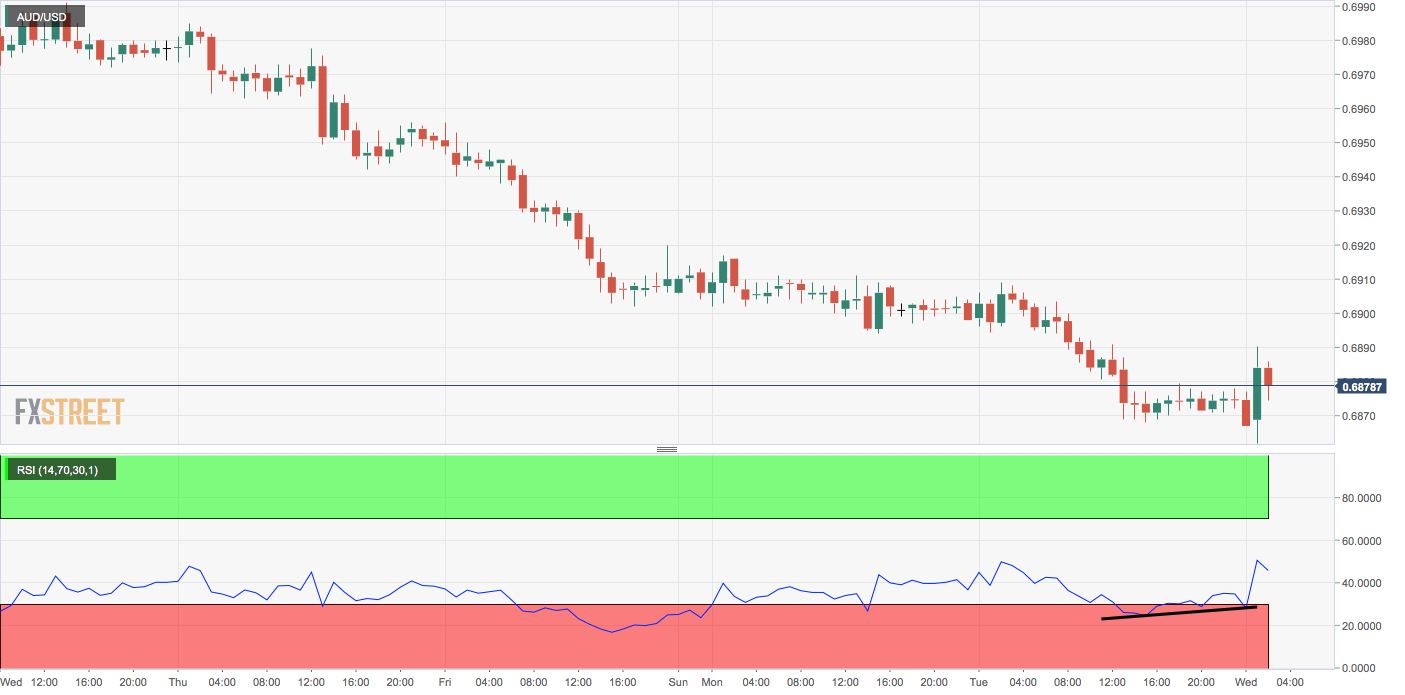
Trend: Bullish
Pivot points
