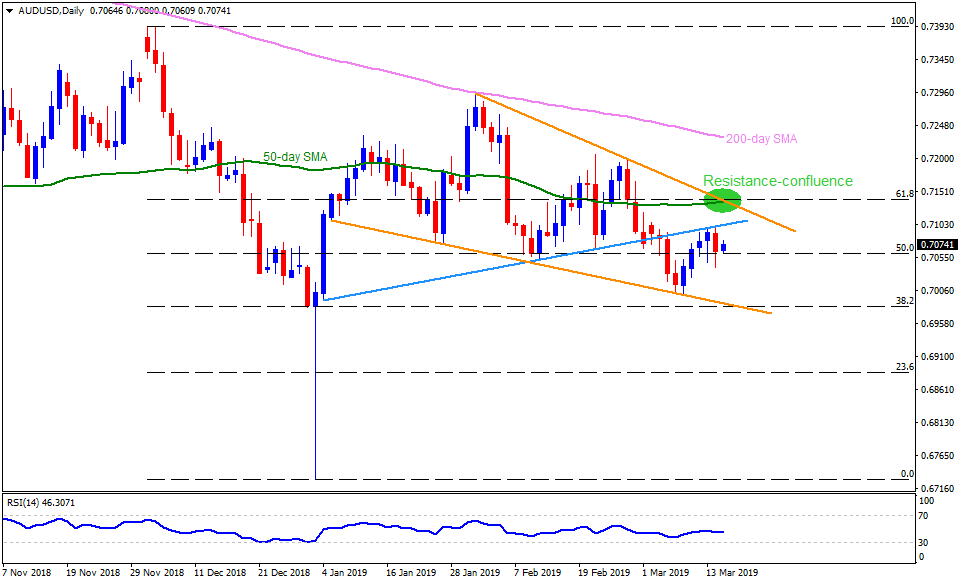
AUD/USD daily chart The Australian Dollar (AUD) is presently a little stronger against the US Dollar (USD) around 0.7070 on early Friday. Considering descending trend-lines joining highs since late-January and important lows since January 07, a short-term “Falling Wedge” bullish chart pattern is underway on the AUD/USD pair’s daily chart. An upward sloping trend-line connecting low of January 04 to February month lows offer immediate resistance at 0.7110. However, pair’s upside past-0.7110 has to cross 0.7140 resistance confluence comprising 50-day simple moving average (SMA), 61.8% Fibonacci retracement of December – January decline and falling wedge resistance. In case prices rally beyond 0.7140 on a daily closing basis, they validate bullish pattern favoring a rise to 0.7200 and 200-day SMA level of 0.7230. Meanwhile, 0.7050, 0.7015 and 0.7000 can act as consecutive nearby supports ahead of highlighting the formation support and 38.2% Fibonacci retracement near 0.6980. Should the quote slips under 0.6980, chances of its drop to 0.6950, 0.6910 and 0.6870 can’t be denied. 
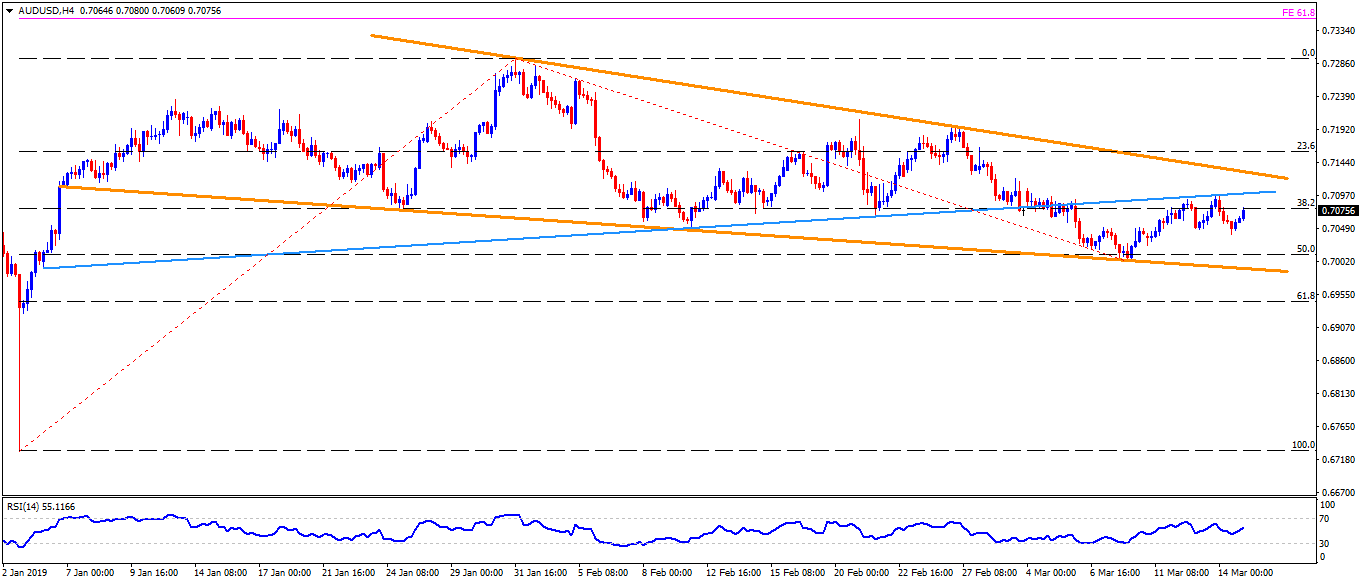
AUD/USD 4-Hour Chart January month high near 0.7300 and 61.8% Fibonacci expansion (FE) of January to March moves, at 0.7355, can further please bulls after 0.7230. Also, 0.6930 could provide an intermediate stop between 0.6950 and 0.6910. 
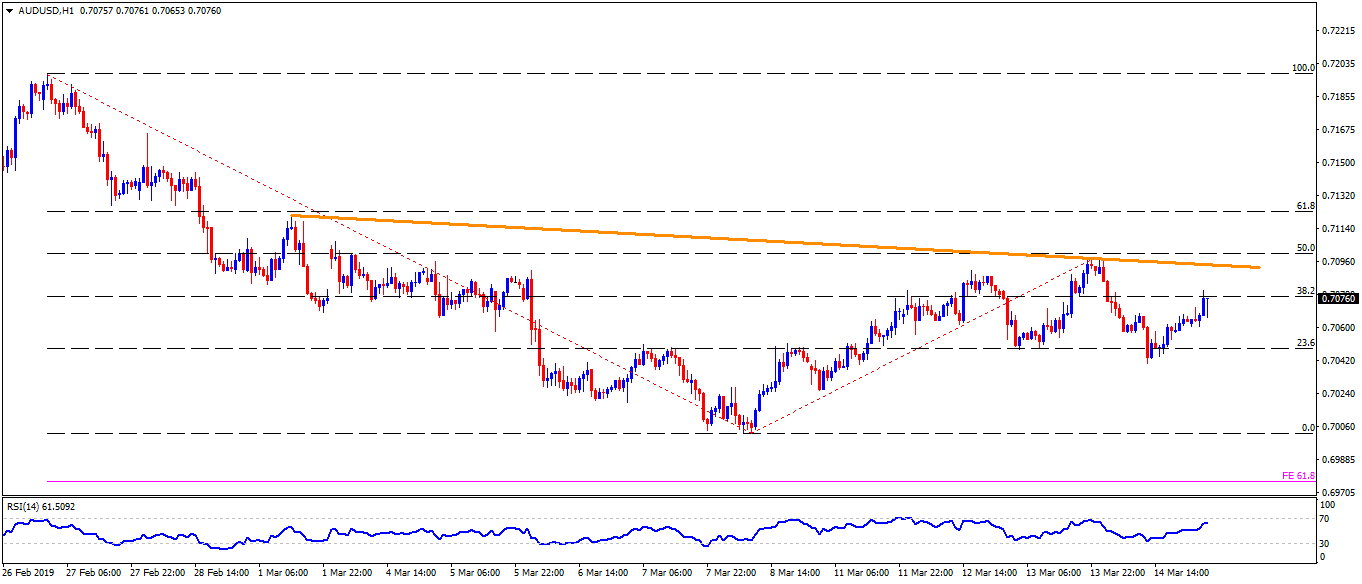
AUD/USD hourly chart 61.8% Fibonacci Retracement of February 27 to March 08 decline at 0.7125 could challenge buyers past-0.7110. 0.7040 is likely a small stop past-0.7050 but ahead of 0.7015. FX Street FX Street FXStreet is the leading independent portal dedicated to the Foreign Exchange (Forex) market. It was launched in 2000 and the portal has always been proud of their unyielding commitment to provide objective and unbiased information, to enable their users to take better and more confident decisions. View All Post By FX Street FXStreet News share Read Next Stock Exchange of Thailand to launch a digital assets platform in 2020 FX Street 4 years AUD/USD daily chart The Australian Dollar (AUD) is presently a little stronger against the US Dollar (USD) around 0.7070 on early Friday. Considering descending trend-lines joining highs since late-January and important lows since January 07, a short-term "Falling Wedge" bullish chart pattern is underway on the AUD/USD pair's daily chart. An upward sloping trend-line connecting low of January 04 to February month lows offer immediate resistance at 0.7110. However, pair's upside past-0.7110 has to cross 0.7140 resistance confluence comprising 50-day simple moving average (SMA), 61.8% Fibonacci retracement of December - January decline and falling wedge resistance. In case prices rally… Regulated Forex Brokers All Brokers Sponsored Brokers Broker Benefits Min Deposit Score Visit Broker 1 $100T&Cs Apply 0% Commission and No stamp DutyRegulated by US,UK & International StockCopy Successfull Traders 9.8 Visit Site FreeBets Reviews$100Your capital is at risk. 2 T&Cs Apply 9.8 Visit Site FreeBets Reviews$100Your capital is at risk. 3 Recommended Broker $100T&Cs Apply No deposit or withdrawal feesTrade major forex pairs such as EUR/USD with leverage up to 30:1 and tight spreads of 0.9 pips Low $100 minimum deposit to open a trading account 9 Visit Site FreeBets ReviewsYour capital is at risk. 4 T&Cs Apply Visit Site FreeBets ReviewsYour capital is at risk. 5 Recommended Broker $0T&Cs Apply Trade gold, silver, and platinum directly against major currenciesUp to 1:500 leverage for forex trading24/5 customer service by phone and email 9 Visit Site FreeBets ReviewsYour capital is at risk.