- AUD/USD struggles around the resistance-turned-support line after the year-start declines.
- 61.8% Fibonacci retracement and 200-day SMA to follow the breakdown.
- Buyers can aim for July’s top above the fresh weekly high.
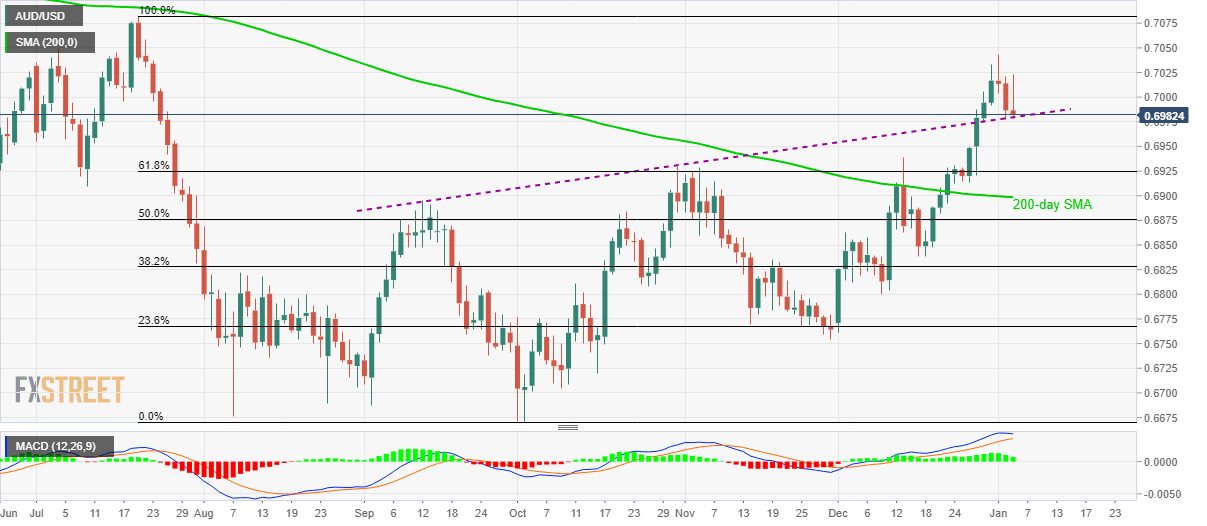
AUD/USD seesaws around 0.6985/90 during early Friday. The pair dropped heavily the previous day but an upward sloping trend line since early September limits the latest declines.
Considering the bullish signals from MACD and a likely bounce off the key support line (previous resistance), prices may recovery to the recent top near 0.7045.
However, pair’s rise past 0.7045 will not hesitate to challenge the July month top near 0.7085 while targeting 0.7100 round-figure.
On the flip side, a price decline below the aforementioned support line, at 0.6978 now, can fetch the quote to 61.8% Fibonacci retracement of July-October declines, at 0.6925.
Additionally, the 200-day SMA level around 0.6900 also can question sellers past-0.6900.
AUD/USD daily chart
Trend: Bullish
