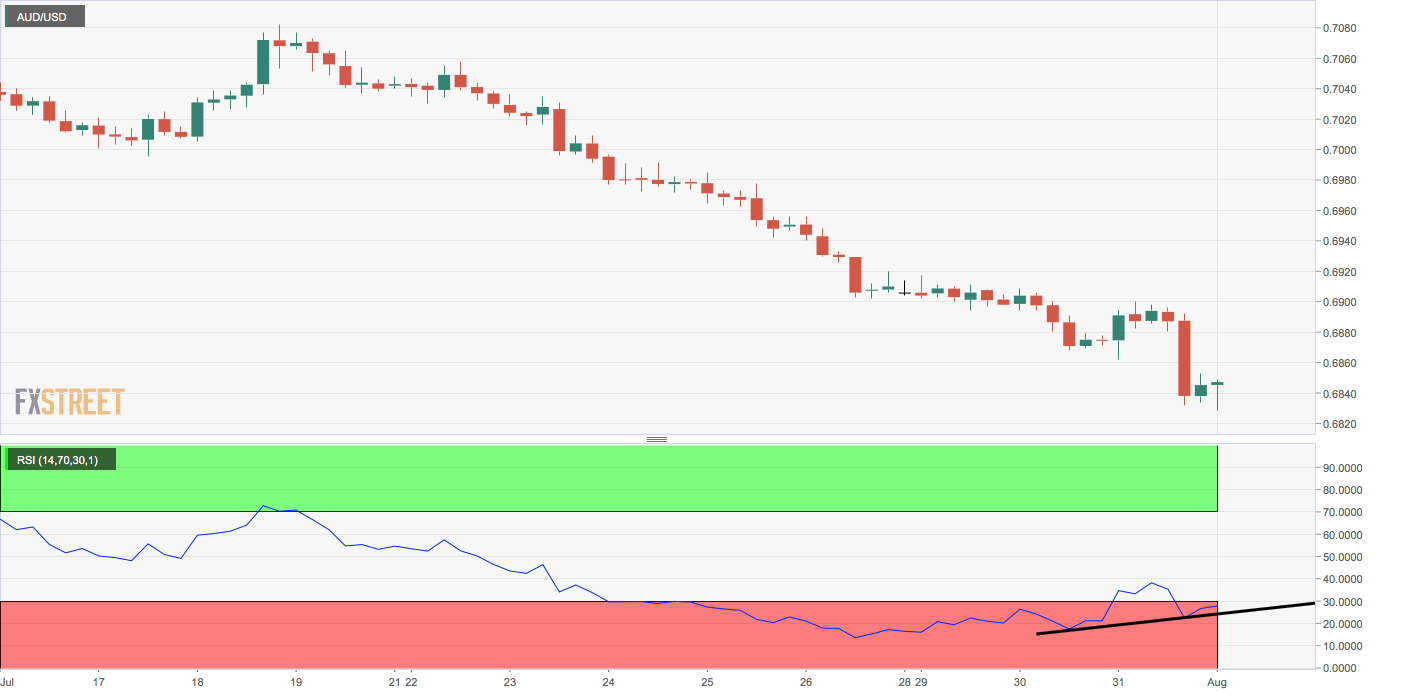
- AUD/USD has recovered from the seven-month low of 0.6828 hit earlier today
- Aussie may rise further toward 0.6860, as the 4-hour chart is showing a bullish indicator divergence.
AUD/USD took a beating in early Asia, falling to 0.6828, the lowest level since Jan. 3, on broad-based US Dollar demand.
As of writing, the spot is trading at 0.6842, representing marginal losses on the day.
The relative strength index (RSI) on the 4-hour chart is now reporting a bullish divergence (higher lows). The hourly RSI is also flashing a similar development.
So, further extension of the corrective bounce toward resistance at 0.6860 cannot be ruled out.
A better-than-expected Aussie data released at 01:30 GMT also favors a stronger corrective bounce.
The import price index for the second quarter came in at 0.9%, bettering the estimated drop of 1.4% by a big margin. Meanwhile, the export price index also beat estimates with a 3.8% print.
4-hour chart
Trend: Oversold bounce
Pivot points

