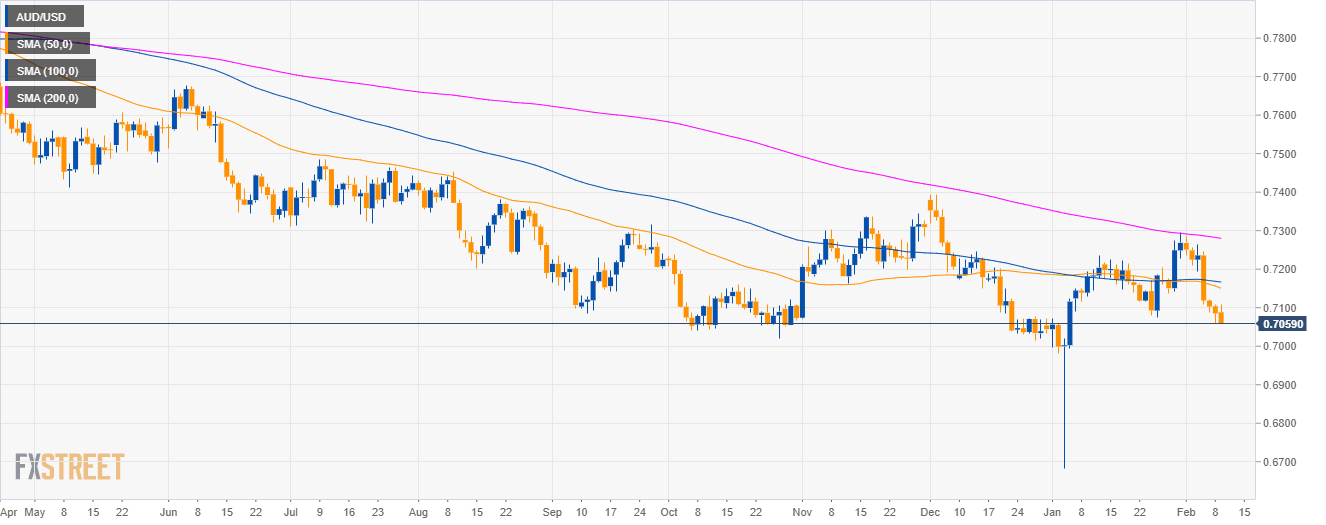
AUD/USD daily chart
- AUD/USD is trading in a bear trend below its main simple moving average (SMAs).
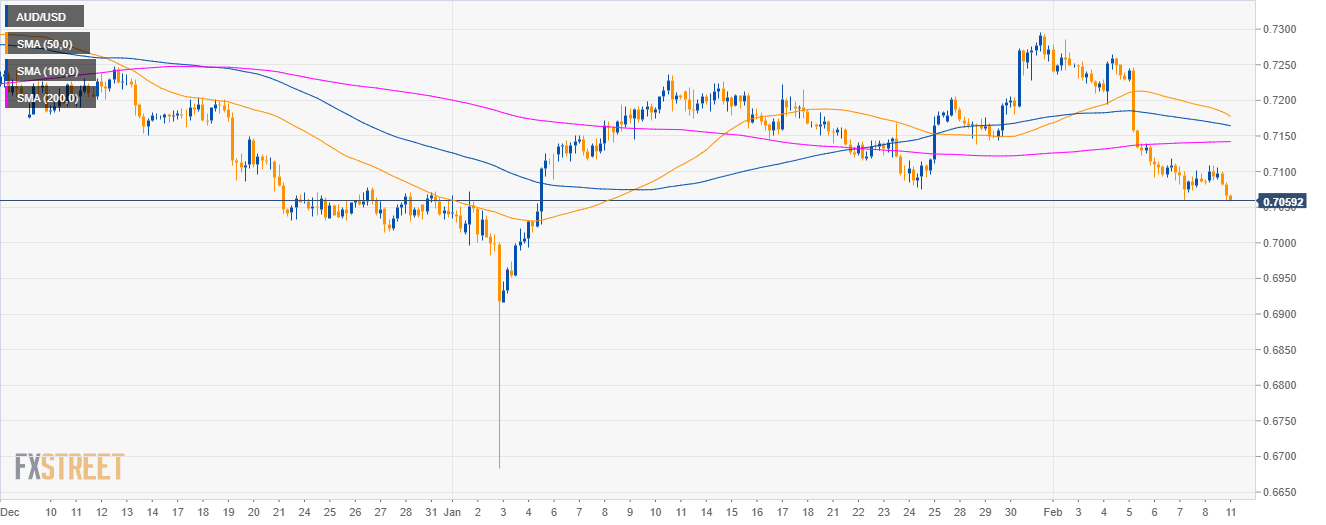
AUD/USD 4-hour chart
- AUD/USD is trading below its main SMAs suggesting bearish momentum in the medium-term.
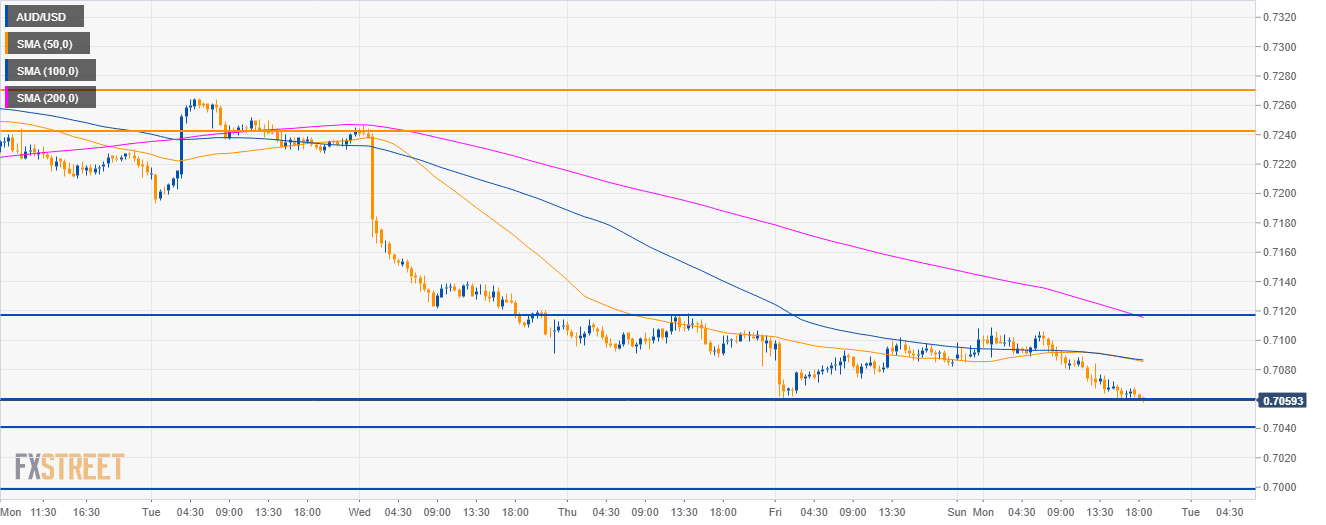
AUD/USD 30-minute chart
- Aussie is trading below its 100 and 200 SMAs suggesting bearish momentum in the short-term.
- Bears are challenging last week low and they will need to overcome the 0.7060 support in order to travel to 0.7000 figure to the downside.
- On the flip side, the level to beat for bulls is 0.7120.
Additional key levels
AUD/USD
Overview:
Today Last Price: 0.7059
Today Daily change: -26 pips
Today Daily change %: -0.37%
Today Daily Open: 0.7085
Trends:
Daily SMA20: 0.7174
Daily SMA50: 0.7156
Daily SMA100: 0.7169
Daily SMA200: 0.7283
Levels:
Previous Daily High: 0.7107
Previous Daily Low: 0.706
Previous Weekly High: 0.7265
Previous Weekly Low: 0.706
Previous Monthly High: 0.7296
Previous Monthly Low: 0.6684
Daily Fibonacci 38.2%: 0.7078
Daily Fibonacci 61.8%: 0.7089
Daily Pivot Point S1: 0.7061
Daily Pivot Point S2: 0.7037
Daily Pivot Point S3: 0.7014
Daily Pivot Point R1: 0.7108
Daily Pivot Point R2: 0.7131
Daily Pivot Point R3: 0.7155
