- Symmetrical triangle challenges traders ahead of the key event.
- Yesterday’s RBA-led price moves can be observed for guidance.
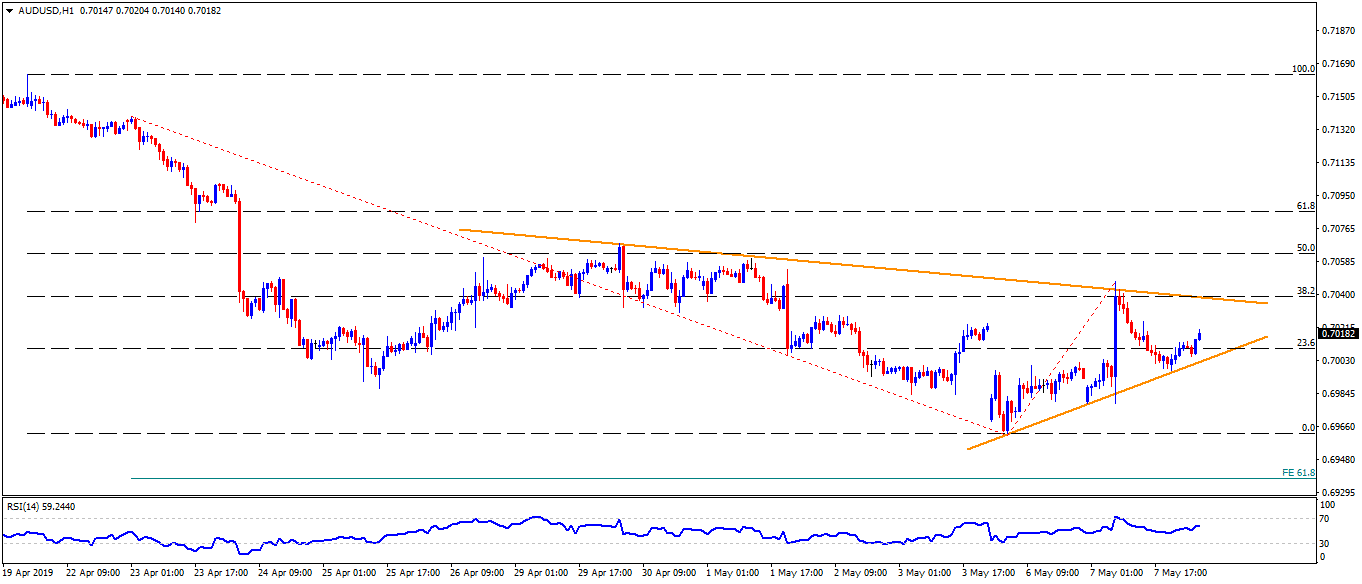
While observing the AUD/USD pair’s trading pattern since April 30 on an hourly chart, a short-term symmetrical triangle grabs market attention. The quote seesaws around 0.7015 ahead of China trade balance data scheduled for release at 02:00 GMT on Wednesday.
The market expects an increase in trade balance to $35.00 billion from $32.67 billion prior while export and import could register 2.3% and -3.6% figures versus 14.2% and -7.6% earlier readouts.
The pattern resistance and 38.2% Fibonacci retracement of April 19 to May 06 downside can limit immediate upside around 0.7040, a break of which may propel the recovery towards 0.7070.
If prices rise above 0.7070, 0.7100, 0.7130 and 0.7165 could become buyers’ favorites.
On the downside, an ascending trend-line stretched since Monday highlights the importance of 0.7000 round figure as nearby support.
Should there be additional declines under 0.7000, 0.6980, 0.6960 and 61.8% Fibonacci expansion (FE) near 0.6940 can grab market attention.
AUD/USD hourly chart
Trend: Sideways
