In the US, NFP fell short of expectations, but this did not hurt the greenback’s momentum, especially as other wage growth and jobless numbers were more positive. There were no surprises from the RBA, which left the benchmark rate at 1.50%. Australian Retail Sales posted a gain of 0.4%, beating the estimate.
AUD/USD reversed directions last week and lost about 80 points, as the pair closed the week at 0.7560. It’s a quiet week, with six events on the schedule. Here is an outlook on the major market-movers and an updated technical analysis for AUD/USD.
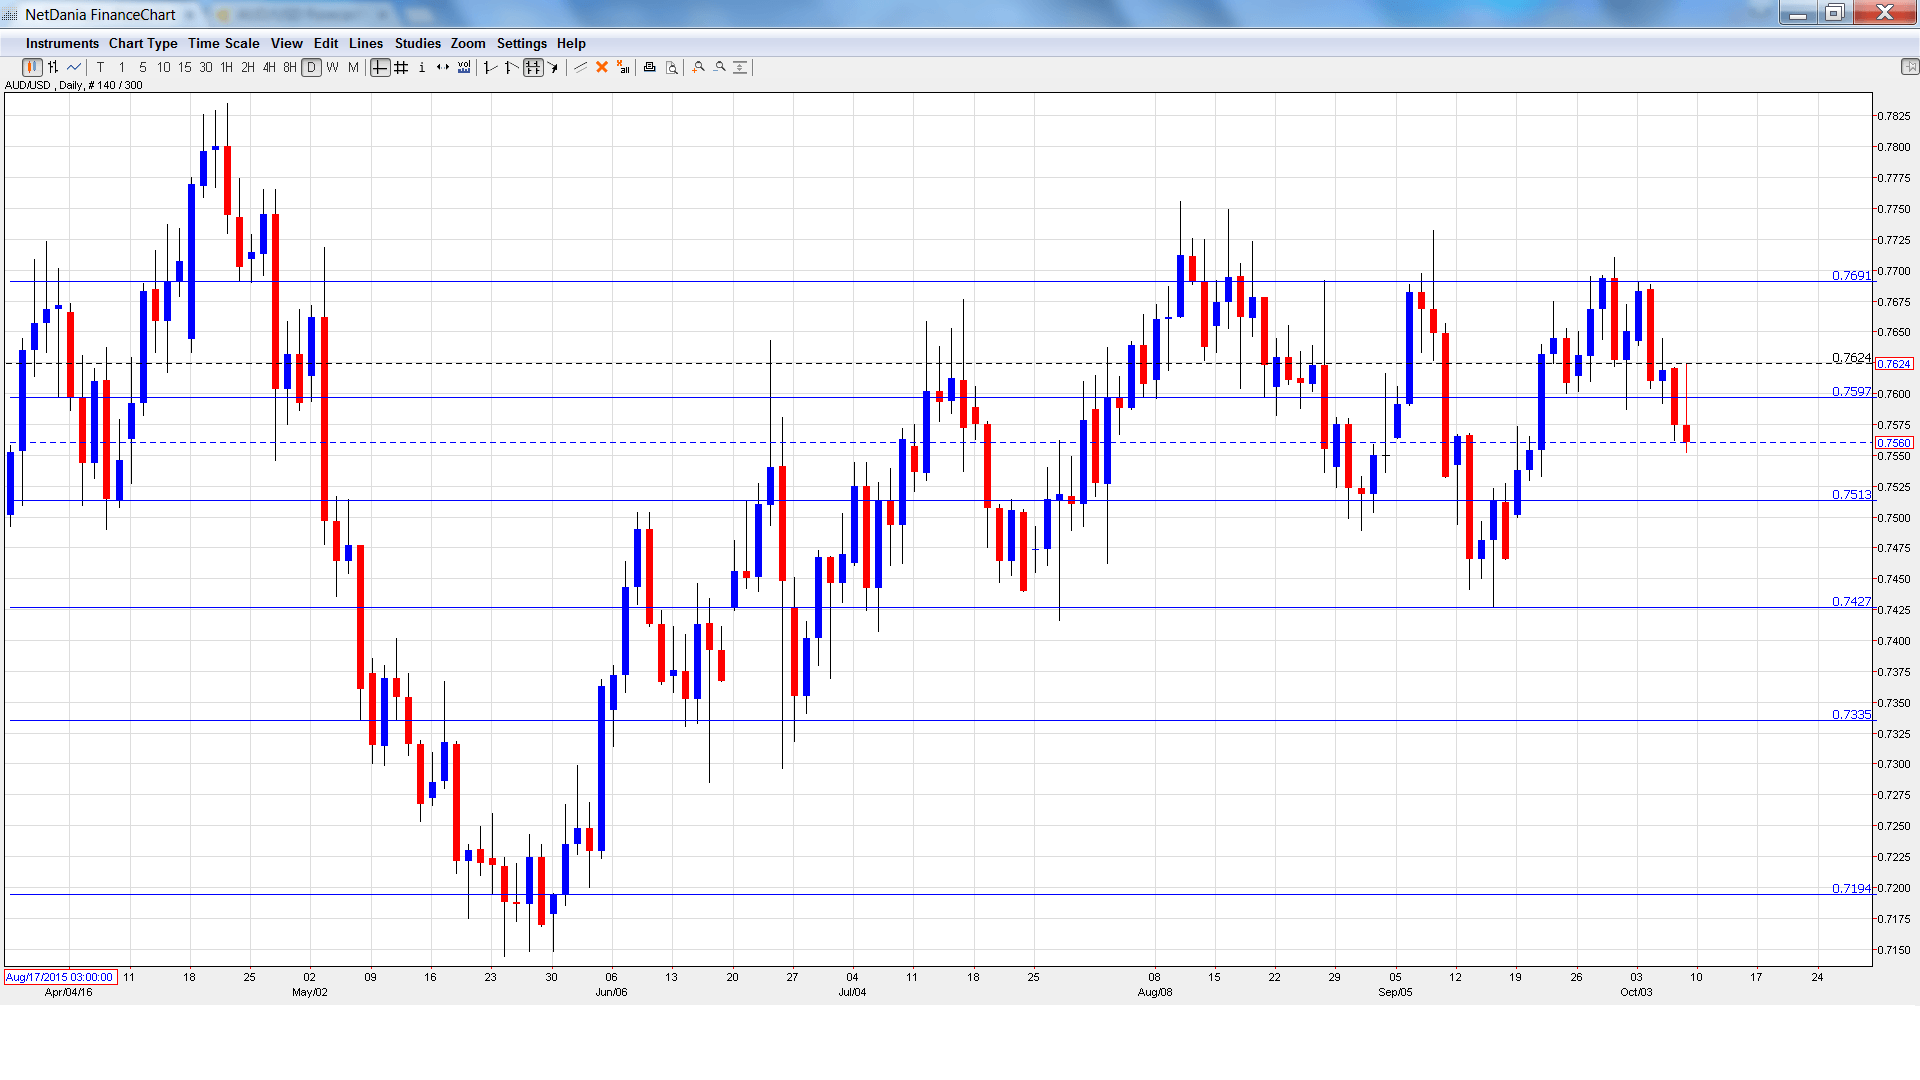
AUD/USD graph with support and resistance lines on it. Click to enlarge:
- NAB Business Confidence: Tuesday, 00:30. The indicator improved to 6 points in August, marking a 3-month high. Will we see another strong gain in the September release?
- Home Loans: Tuesday, 00:30. Home Loans provides a snapshot of the level of activity in the housing sector. The indicator posted a sharp decline of 4.2%, well off the forecast of a 1.3% decline. The estimate for the September report stands at -1.3%.
- Westpac Consumer Sentiment: Tuesday, 23:30. The indicator posted a small gain of 0.3% on August, after a sharp gain of 2.0% a month earlier. Will the indicator post another gain in September?
- MI Inflation Expectations: Thursday, 00:00. This indicator helps analysts track actual inflation figures. The indicator has been losing ground in recent readings and dropped to 3.3% in August. Will the downward trend continue in the September report?
- Chinese Trade Balance: Thursday, Tentative. Chinese key numbers can have a significant impact on the movement of the Aussie, as the Asian giant is Australia’s number one trading partner. Trade Balance came in at $346 billion in August, well short of $372 billion. The indicator is expected to surge to $365 billion in September.
- RBA Financial Stability Review: Friday, 00:30. This report is released twice each year. The review looks at conditions in the financial system and risks to financial stability. A report that is unexpectedly pessimistic could unnerve the markets and send the Aussie downwards.
AUD/USD Technical Analysis
AUD/USD opened the week at 0.7642. The pair touched a high of 0.7691 and then reversed directions, dropping to a low of 0.7552 late in the week, as support held firm at 0.7513 (discussed last week). AUD/USD closed the week at 0.7560.
Live chart of AUD/USD:
Technical lines from top to bottom:
We start with resistance at 0.7938.
0.7835 has been a cap since April.
0.7691 has been the high point in October.
0.7597 was tested in support for a second straight week.
0.7513 is the next support level.
0.7427 marked the low point for the month of September.
0.7334 was a cap in December 2015.
0.7194 is next.
0.7093 is the final support level for now.
I remain bearish on AUD/USD
US numbers have generally been positive, so a December rate hike remains on the table. With the RBA under pressure to lower rates due to weak inflation levels, monetary divergence continues to favor the greenback.
Our latest podcast is titled Bold BOJ vs. Fearful Fed
Follow us on Sticher or iTunes
Further reading:
- For a broad view of all the week’s major events worldwide, read the USD outlook.
- For EUR/USD, check out the Euro to Dollar forecast.
- For the Japanese yen, read the USD/JPY forecast.
- For GBP/USD (cable), look into the British Pound forecast.
- For the Canadian dollar (loonie), check out the Canadian dollar forecast.
- For the kiwi, see the NZD/USD forecast.
