- BNT/USD had a 24% price surge on June 23.
- Bancor is not facing many resistance levels towards $2.
BNT/USD continues with its bullish path to $2 after a notable amount of continuation on June 24 peaking at $1.299. The daily chart has formed a bull flag which could get extended for a few days. The MACD flipped positively on June 22 and the RSI is overextended again.
BNT/USD 4-hour chart
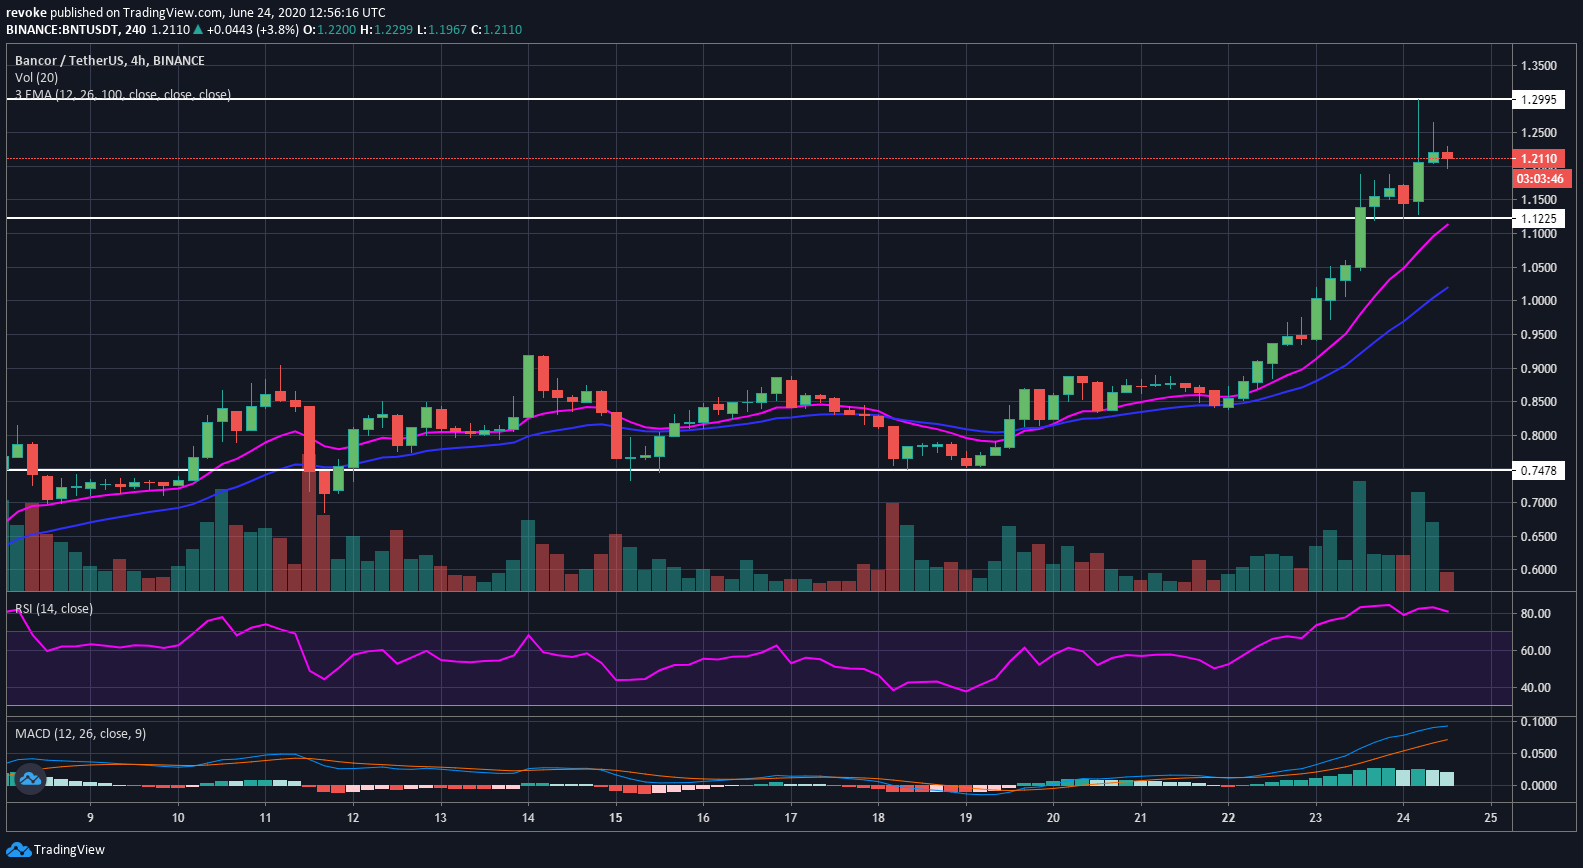
The 4-hour chart clearly shows that the recent bull rally is not just one whale pushing the price. The move happened over the course of 60 hours, however, BNT had no consolidation so far and the 4-hour RSI is still extremely overextended. A pullback is needed and buyers can use the 12-EMA established at $1.11 for support.
The $1.12 level is also a support level, the low of June 24 on the 4-hour chart. Either way, even if the 12-EMA is lost, the 4-hour uptrend would remain intact, in fact, anything above $0.83 is basically a higher low and a continuation of the trend.
