- BCH/BTC is in a consolidation zone and a breakout seems close
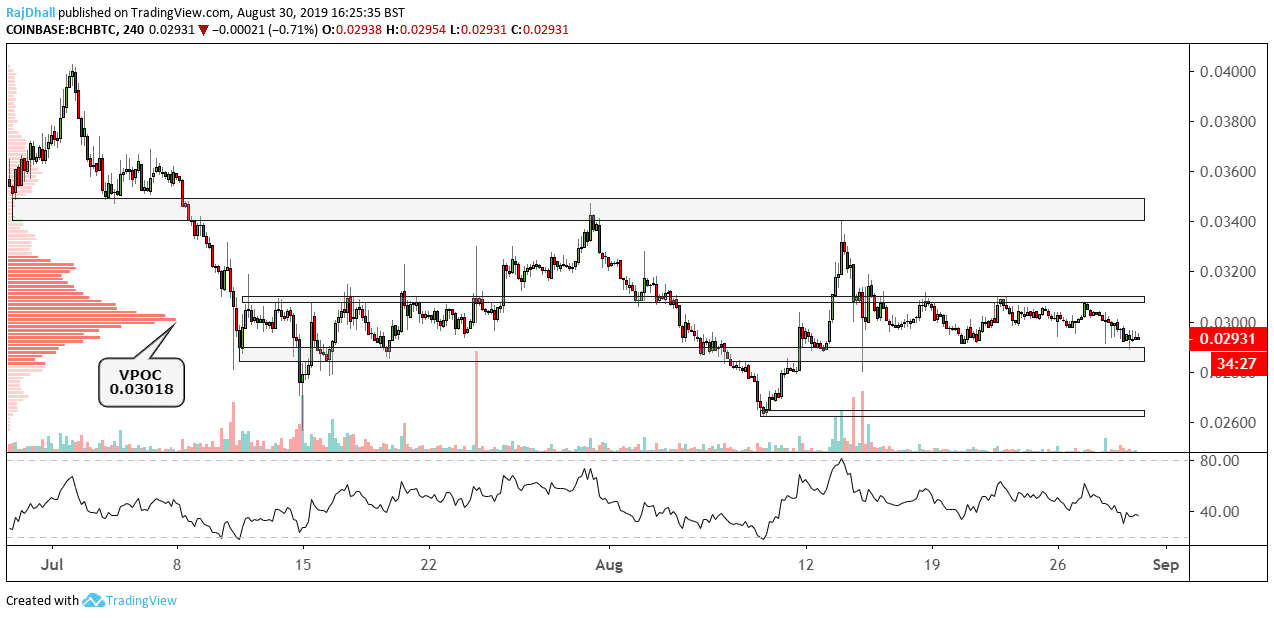
- The mean value is hanging around 0.03018 and any move through can be considered bullish
- On the downside support is at 0.02900 and just above the 0.02600 levels.
Bitcoin Cash has held up well against Bitcoin over the last few weeks and if you watch the cryptocurrencies closely when we get a drop in sentiment Bitcoin often performs slightly worse than Bitcoin Cash.
On the 4-hour chart above you can see since the lows near 0.026 there has been a significant price recovery and consolidation. There was a small period of higher highs and higher lows that took the price up to 0.03407. Since that point price has now entered a consolidation range between 0.03100 and 0.02900. The lower part of the consolidation is under threat today however.
On the left-hand side of the chart is the composite volume profile this is showing us that most contracts have been traded at 0.3018 (VPOC). This can be considered the mean value and any break above would be a bullish signal but price often spikes and rejects levels with such a strong pull.
Lastly, the RSI indicator is on the negative side but still not in oversold territory. If you look back through BCH/BTC the overbought/oversold indications seem to be a pretty reliable indicator of exhaustion. So let’s see what happens if we head lower into the oversold zone nearer to 20.
