- Bitcoin Cash stays in the green awaiting bullish flag pattern breakout.
- Sideways trading to continues as bullish pressure equalizes bear pressure.
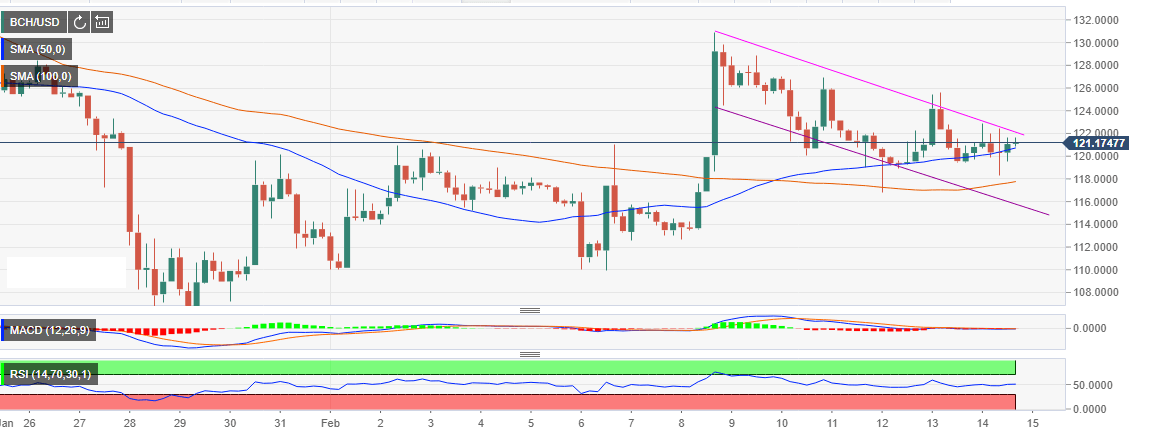
Bitcoin Cash is in consolidation around $120. It recently tested the critical level at $130 but began correction lower. The crypto slightly in the green at the time of writing. However, it has been recording lower highs and lower lows.
Short-Term support has been established at $118; a zone highlighted by the 4-hour 100-day Simple Moving Average (SMA). The 50-day SMA in the same range is offering immediate support currently at $120.80 while Bitcoin Cash is trading at $121.01.
At the moment, the bullish and bearish pressure is affecting the price in equal measures and BCH/USD is expected to trend sideways in the near-term. Similarly, the Relative Strength Index (RSI) on the same 4-hour chart is horizontal at 50%. The RSI has stayed above this level since it retreated from the oversold region on January 9.
In the medium-term, a bullish flag pattern break could place Bitcoin on a trajectory towards $130. On the flipside, if the bears overpower the bulls and a reversal occurs below the support at $118, BCH will find other anchor zones at $114, $110 and $105.
BCH/USD 4-hour chart