BCH/USD daily chart
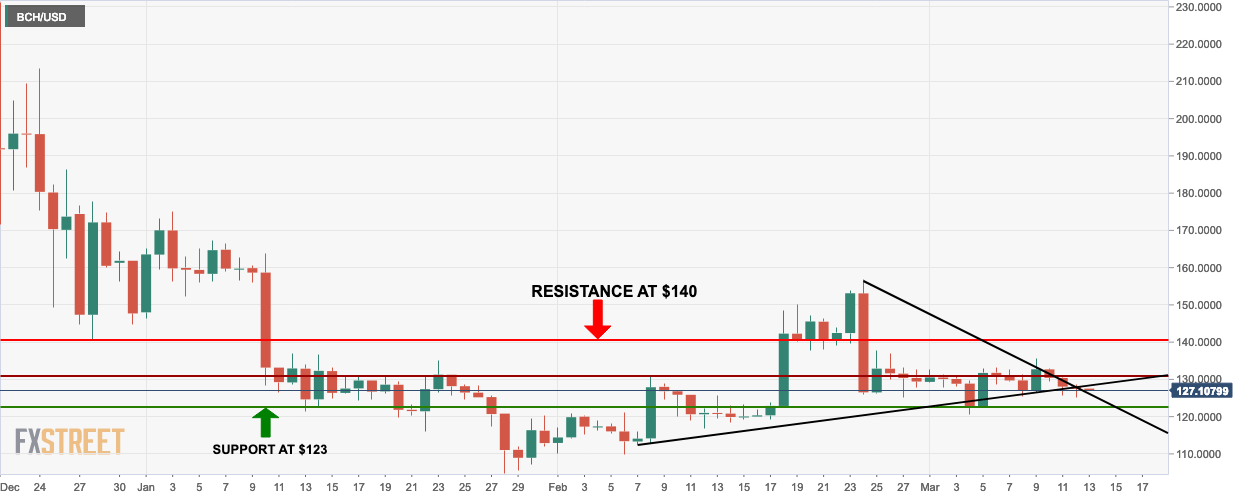
- BCH/USD has had a bearish breakout from a triangle formation.
- Bulls will need to defend immediate support which lies at $127.
BCH/USD 4-hour chart
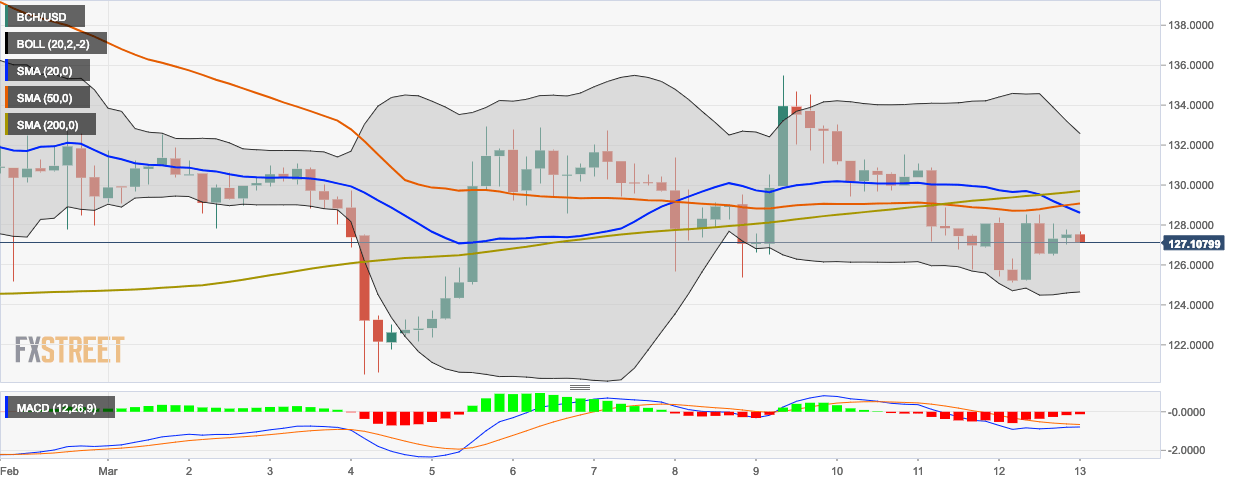
- The BCH/USD 4-hour chart is trending in the middle of the 20-day Bollinger band which indicates that the market is not strongly bearish.
- The 20-day simple moving average (SMA 20), SMA 50, and SMA 200 curves are all trending above the market, which indicates a bearish market.
- The SMA 200 has already crossed over the SMA 50 curve which is called a “death cross” and is a strong sell signal.
BCH/USD hourly chart
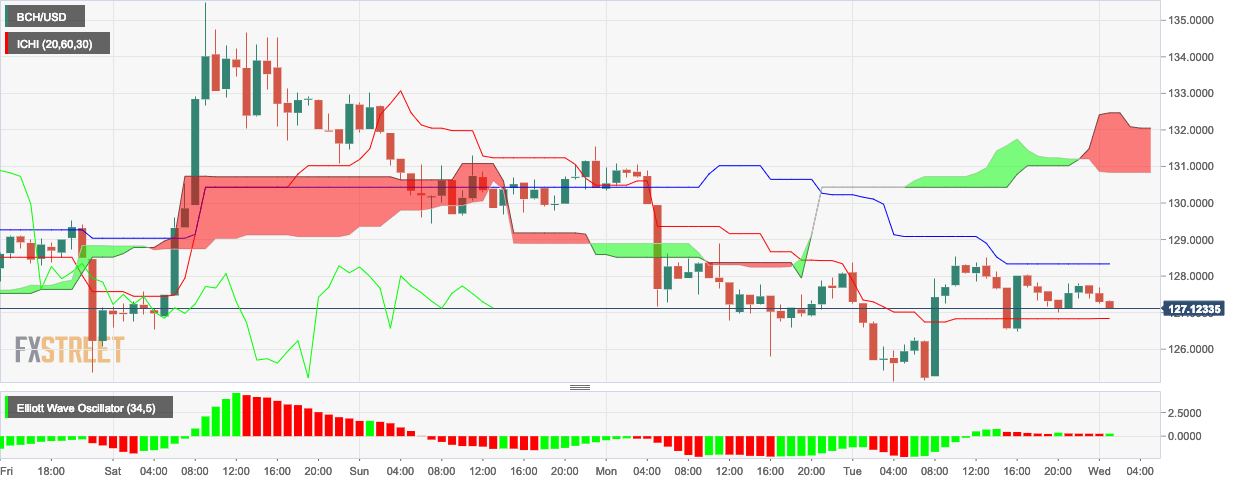
- The Ichimoku indicator shows an upcoming thick bearish cloud for the BCH/USD hourly market.
- The Elliot wave’s latest session is bullish even though majority sentiment remains bullish.
Key Levels
- Resistance 3: $132.4006
- Resistance 2: $130.4683
- Resistance 1: $128.9942
- Pivot Point: $127.0619
- Support 1: $125.5877
- Support 2: $123.6554
- Support 3: $122.1813
